All published articles of this journal are available on ScienceDirect.
Matrix Metalloproteinases 2 and 9 are CAD More Relevant Biomarkers Than -1, -8, and -12 to Separate CAD from Non-CAD Patients
Abstract
Background:
Atherosclerotic Carotid Artery Disease (CAD) is a frequent cause of mortality worldwide. The discovery of biomarkers that evidenced CAD progression would help with cardiovascular risk reduction. Extracellular Matrix Metalloproteinases (MMPs) have been associated with plaque progression, lesion aggravation, and rupture.
Objective:
This study evaluated that MMPs serum optical-densities and digestive gel-activity are associated with CAD.
Methods:
This cross-sectional study evaluated 65 outpatients presenting CAD (n=31) or not (n=34). The Carotid disease was evidenced by Doppler echography. ELISA and SDS-PAGE zymography were performed to determine MMPs serum optical-densities and proteolytic-activity. Principal Component Analysis (PCA) was performed to identify the most relevant MMPs (MMP-1, 2, 8, 9 and 12).
Results:
MMP-2 and MMP-9 showed lower serum optical-densities in CAD (MMP-2, p = 0.0246; and MMP-9, p < 0.0001), but higher digestive enzymatic activity when compared to non-CAD samples (p < 0.0001). PCA analysis strengthens the singling out of those individual MMPs as predictors of choice to differentiate CAD from non-CAD patients as opposed to others MMPs. Analysis of the loadings showed MMP-2 and MMP-9 as the most important independent variables to separate CAD from non-CAD patients.
Conclusion:
MMP-2 and MMP-9 are more relevant biomarkers for CAD than the other MMPs analyzed.
1. INTRODUCTION
Atherosclerosis is a multifactorial disease with outcomes that can be identified by measurement of markers such as plaque presence or extension, modifications in vascular wall components, blood hemodynamics, vessel lumen stenosis, and inflammatory markers. Atherosclerotic Carotid Artery Disease (CAD) is a frequent cause of morbidity and mortality worldwide. The identification of biomarkers that contribute to CAD would help not only to improve risk stratification but also to implement novel preventive therapies, in addition to classical ones like lipid-lowering and anti-thrombus formation. The latter two despite their effectiveness, unfortunately, do not abrogate the risk of cardiovascular events [1, 2].
Immune and inflammatory pathophysiological processes have gained remarkable interest in the last decades due to association with CAD development, because those processes can generate specific serum measurable biomarkers [2-5], such as Metalloproteases (MMP), that are commonly related to vascular wall remodeling [6, 7]. Each MMP is a site active zinc endopeptidase, which acts as calcium-dependent zymogens or pro-enzymes, in a non-active form. The MMP is activated by various matrixes and is implicated in extracellular matrix protein degradation, by breaking specific peptide bond, This results in vascular remodeling, a blood vessel adaptive process [6, 7]. The tissue Metalloproteinases Inhibitors (TIMP) regulate the action of MMP in the vascular microenvironment; on the other hand, α2-macroglobulin controls MMP activity in plasma. In fact, there are four types of TIMP (TIMP-1, 2, 3, 4), which controls MMP activities by creating high-affinity complexes, characterized by the formation of non-covalent binding with the catalytic domain. The latency of MMP as a zymogen (pro-MMP) is sustained by the interaction with a cysteine residue into a domain zinc active center that causes substrate blockage [6]. The MMP activity is triggered at the beginning of the inflammatory process when monocytes and foam cells are already inside the arterial intima. In addition, MMPs maximize inflammation effect, by increased inflammatory cell recruitment, smooth muscle cell migration, atheroma swelling and, as a consequence, plaque instability [7, 8]. The main MMPs that mediate atherosclerosis development are MMP-1, MMP-2, MMP-3, MMP-7, MMP-8, MMP-9, MMP-12 and MMP-13 [6, 9]. The disintegrins and metalloproteinases proteins (ADAM-1, ADAM-8, ADAM-15), and MMPs tissue inhibitors (TIMP-1 and TIMP-2) [6] also participate in this intricate process.
Some studies have associated circulating MMP and atherosclerosis [10-14], suggesting the existence of either direct or indirect roles of MMP in plaque progression, lesion aggravation and, finally, rupture. Even though MMP vascular release and plasma concentration are associated with plaque composition, the exact mechanism by which MMPs are released from the vascular wall requires further investigation [12, 14-16]. The eventual clinical utility of MMP as an atherosclerosis risk marker depends on how accurate MMP serum levels could indicate plaque instability and/or an elevated risk of cardiovascular disease [10, 11, 13, 15-19]. Therefore, the present study aimed to compare the serum extracellular matrix MMP optical densities and gel digestive activities from CAD and non-CAD patients, to show the biomarkers possible use as indicators of plaque instability and/or cardiovascular risk increasing.
2. MATERIAL AND METHODS
2.1. Study Design and Population
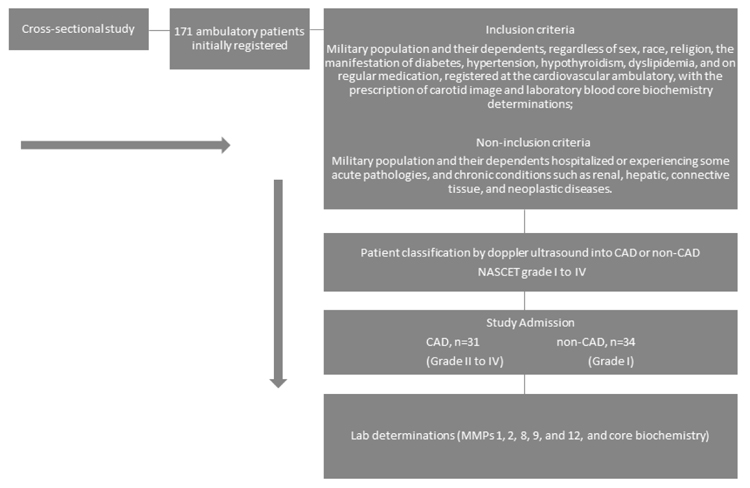
In this cross-sectional study, the patient sample was comprised of military population and their dependents, regardless of sex, race or religion. The sample was selected for convenience, including 65 individuals, aged between 44 and 58 years, from 171 participants initially registered at the Salvador Naval Hospital (HNSa) outpatient clinic. The study was approved by the Federal University of Bahia human research ethics committee – (CEP/MCO/UFBA 09/2005-2016) and all participants signed a free informed consent. The study protocol follows the ethical guidelines of the 1975 declaration of Helsinki. The study design, inclusion and non-inclusion criteria are shown in the flowchart (Fig. 1).
2.2. Sample Size Calculation
By considering a minimum inclusion of 30 patients with CAD (NASCET) grade II to IV, and 30 without CAD in a cohort of 171 participants, with an expected loss of 1%, the minimum required sample size to obtain significance would not be less than 31 subjects per group. The calculated sample size estimates a sample sufficient to obtain a statistical power of at least 95% (1-β), considering a 10% variation, capable of detecting serum MMP optical densities differences of 9.48 between patients with and without CAD. The sample calculation was performed with WINPEPI software for Windows, version 11.48; Joe Abramson, PEPI - programs for epidemiologists.
2.3. CAD Characterization
CAD characterization was performed by two observers, to reduce bias and improve data quality, by using color uni-bidimensional doppler ultrasound (Envisor C series M2540A, PHILLIPS Medical Systems) as previously reported [20]. The stenotic degrees caused by atheroma plaques in carotid arteries were classified according to the North American Symptomatic Carotid Endarterectomy Trial (NASCET) [21]: level I (normal), level II (between 1% and 29%), level III (between 30% and 49%), level IV (between 50% and 69%), level V (between 70% and 99%) and level VI total occlusion (100%).
The selected patients after doppler ultrasound characterization comprised of 31 (47.7%) patients with CAD (NASCET) grade II to grade IV, and 34 patients without carotid artery disease (non-CAD) (52.3%). CAD and non-CAD patients were paired by age, sex, and baseline disease distribution.
2.4. Laboratory Analysis
Laboratory markers of total cholesterol, HDL-c, LDL-c, triglycerides and glucose were determined at the Laboratory of Clinical Biochemistry (LCB). MMP-1, 2, 8, 9 and 12 ELISA detection and zymography were carried out at the Laboratory of Clinical Immunology (SIDI), from the Faculty of Pharmacy, at the Federal University of Bahia, Brazil - UFBA.
2.5. Zymography
Serum enzyme proteolytic activity was evaluated and characterized by SDS-PAGE zymography, using a 10% gel copolymerized with 0.1% gelatin. Patient’s serum electrophoretic separation was carried out by using the method described by Laemmli (1970), with adjustments [22]. Following electrophoresis, the gel was washed twice with 2.5% Triton X-100 in 50mMol Tris-HCl, containing 5mMol CaCl2 and 1µMol ZnCl2 at pH 7.6 by 1h at room temperature. Then, the gel was incubated at 37°C in Tris-HCl containing 5mMol CaCl2 and 1µMol ZnCl2 at pH 7.6, overnight (± 12h). After that, the gel was stained with 0.5% Coomassie blue G-2500® in methanol: acetic acid (30:10, v/v) for 90 minutes, and washed-out (overnight) with the same solution without the dye. The proteolytic activity was recognized by clear zones on the gel (e.g., gelatin substrate) where serum samples migrate. The molecular weight was assessed with molecular standards between 6 - 180kDa (Invitrogen-10748-010, BenchMark Pre-Stained Protein Ladder) and between 10 – 220kDa (Invitrogen-10747-012, BenchMark Protein Ladder). Gels were scanned for image analysis and processing at ImageJ 1.41 (Wayne Rasband, National Institutes of Health, USA) [23]. The processing includes the digested area calculation in square millimeters, by gel densitometry. After standardization, each assay was done in triplicate and shown a maximum coefficient of variation (C.V.) of 9.98%.
2.6. ELISA (Enzyme-Linked Immunosorbent Assay)
The sandwich ELISA assays were carried out [24] by diluting anti-MMP (1, 2, 8, 9 and 12) mouse anti-human MMP monoclonal antibody (100µg/mL) supplied from Millipore Co. (www.millipore.com) a subsidiary company of Chemicon® International (Serological Company – www.chemicon.com) in CBB buffer pH 9.6, in triplicates, into a 96 wells plate, followed by overnight incubation at 4ºC. The plate was then washed three times with PBS-Tween (0.05%), and blocked by using 200µL of PBS+BSA at each well for 2h. Following the ELISA protocol, the plate was washed three times with PBS-Tween (0.05%). The patient samples were pipetted into the plate wells and incubated at 37ºC for 2h. Following a second washing, diluted anti-MMPs (PBS+BSA 0.5%) was added to the plates, followed by 1h incubation at 37ºC and another washing procedure with PBS-Tween, as previously described. The secondary antibody, Biotinylated Universal Link (DAKO®) was added to the plate wells and incubated, at 37ºC, for 15 to 30 min. Then, a final washing was carried out. Next, the Streptavidin-HRP conjugate (DAKO®) were pipetted into the plate wells and incubated again, at room temperature, for 15 to 30 min, followed by one more washing step. After that, the revealing substrate 3, 3’-diaminobenzidine (DAB) (DAKO®) was applied (20 µL/mL). An acid solution (H2SO4 2N) was instilled after 15 min. to stop the reaction. The ELISA plates were read at 450nm at a microplate reader (TP-Reader-ThermoPlate®) to obtain the optical densities.
2.7. Statistical Analysis
Data are shown as box plot percentile using a confidence interval of 95%, by an area under the curve (ROC), and by gel-digested area calculated in square millimeters. By each step, the normality and outlier (Grubb’s) test were carried out to choose the right inferential statistical test. The serum MMP optical densities obtained by ELISA from CAD and non-CAD groups were analyzed by ANOVA, followed by Tukey multiple comparison tests, considering p < 0.05 into a C.I. of 95% to attain significance. Notably, the data from ELISA optical densities were either evaluated using the Mann-Whitney test, or by comparing two pairs of MMP from each group. Cutoff points were used when necessary to calculate the sensitivity, specificity, positive, and negative predictive parameter determinations, by using the area under the Receiver Operating Characteristic (ROC) curves above 70% and pondering the greatest possible specificity and sensitivity within the pre-established confidence interval. Statistical analyses were performed by using GraphPad Prism v.5.01 software (GraphPad Software, Inc., CA, USA).
2.8. Principal Component Data Analysis
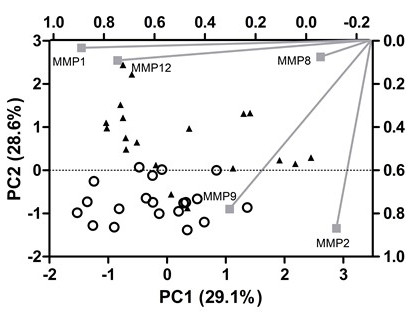
Unscaled data for MMP1, MMP2, MMP8, MMP9, and MMP12 were employed to carry out principal component analysis using a correlation matrix, as available in MINITAB V. 17 software. Principal components with eigenvalues lower than 1.0 were discarded. Then, varimax rotation method was applied to the extracted components. Score and loading plot for the two first principal components were visually analyzed to investigate the most relevant independent variables in differentiating CAD from non-CAD patients.
3. RESULTS
The patients’ clinical baseline disease and core laboratory characterization are shown in Tables 1 and 2, respectively. The ELISA values for MMP1, MMP2, MMP8, MMP9, and MMP12 were condensed into three main components that capture 79% of the variance from the original data. This approach allows most of the information provided by ELISA to be visually analyzed. These components have eigenvalues above 1.0, which indicates that they explain more information than one original variable and are not correlated to each other. Although this approach is suitable for data reduction, it is not the best alternative for data interpretation. Then, an orthogonal rotation method (varimax) was employed to rotate the factors and rescale the importance of each variable to the PCs. Analysis of the score plot shows a clear separation of CAD (positive PC2 values) from non-CAD patients (negative PC2 values). In order to understand the underlying reason for this separation, the loading plot was inspected: MMP-1 and MMP-12 have a high load on PC1 (≥0.80), whereas MMP-2 and MMP-9 contribute mainly to PC2 (≥0.80). Finally, MMP-8 is responsible for PC3 variance (loading > 0.70). Then, MMP-2 and MMP-9 are the most important independents’ variables to separate CAD from non-CAD patients (Fig. 2).
| Baseline Disease Characteristics | CAD n (%) | Non-CAD n (%) | Total n (%) |
|---|---|---|---|
| Dyslipidemia | 25 (81) | 20 (59) | 45 (69) |
| Hypothyroidism | 6 (19) | 9 (27) | 15 (23) |
| Diabetes | 20 (65) | 6 (18) | 26 (40) |
| Hypertension | 27 (87) | 15 (44) | 42 (65) |
| Tabagism | 12 (39) | 8 (24) | 20 (31) |
| Sedentary lifestyle | 19 (61) | 19 (56) | 38 (59) |
| Ethilism* | 29 (94) | 4 (12) | 33 (51) |
| Total participating patients | 31 (48) | 34 (52) | 65 (100) |
| CAD | Urea | Creatinine | Uric Acid | Total CK | TGP (ALT) | Albumin | Total Protein | TGO (AST) | GGT | Glucose | Triglycerides | Cholesterol | HDL-c | VLDL-c | LDL-c |
|---|---|---|---|---|---|---|---|---|---|---|---|---|---|---|---|
| n | 30 | 31 | 31 | 31 | 31 | 30 | 31 | 31 | 31 | 31 | 31 | 31 | 31 | 31 | 31 |
| Mean | 41.97 | 0.99 | 3.63 | 120.74 | 22.98 | 3.67 | 7.03 | 25.00 | 38.61 | 119.94 | 129.26 | 170.55 | 51.65 | 26.38 | 90.19 |
| S.D. | 18.63 | 0.04 | 0.75 | 55.22 | 11.64 | 0.52 | 0.74 | 12.76 | 26.67 | 46.40 | 64.39 | 42.71 | 13.90 | 13.18 | 39.26 |
| non-CAD | Urea | Creatinine | Uric Acid | Total CK | TGP (ALT) | Albumin | Total Protein | TGO (AST) | GGT | Glucose | Triglycerides | Cholesterol | HDL-c | VLDL-c | LDL-c |
| n | 34 | 34 | 31 | 34 | 34 | 33 | 33 | 34 | 33 | 34 | 34 | 34 | 34 | 34 | 34 |
| Mean | 29.82 | 0.84 | 4.15 | 141.0 | 24.79 | 3.89 | 6.92 | 27.03 | 33.65 | 96.18 | 122.7 | 178.1 | 56.18 | 24.50 | 97.44 |
| S.D. | 11.22 | 0.11 | 0.95 | 83.37 | 11.50 | 0.45 | 0.78 | 10.50 | 31.06 | 21.59 | 66.31 | 34.23 | 17.17 | 13.25 | 34.59 |
| p | 0.0387 | NS | NS | NS | NS | NS | NS | NS | NS | 0.0140 | NS | 0.006 | NS | NS | 0.009 |
| MMP1 | MMP2 | MMP8 | MMP9 | MMP12 |
|---|---|---|---|---|
| NS | <0.01* | NS | <0.05* | NS |
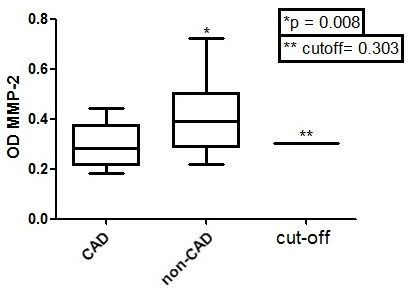
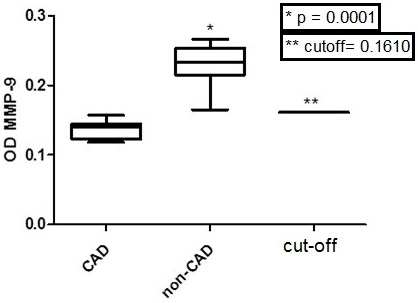
Table 3 shows that only MMP-2 and MMP-9 values, among all tested MMP (1, 2, 8, 9 and 12) optical densities, were significantly different between CAD and non-CAD groups (ANOVA, Tukey Multiple comparison test, p < 0.05 with a 95% C.I). It is important to note that the ELISA Optical Densities (OD) from the same MMP in CAD (MMP-2, p = 0.0246, Mann-Whitney test; MMP-9, p < 0.0001, Mann-Whitney test) were lower when compared to non-CAD (Figs. 3 and 4).
Table 4 shows the study calculated Relative Risk (RR) obtained by examining the risk of CAD presence when MMP OD was measured in serum samples of patients with levels II, III and IV carotid stenosis (NASCET classification). The obtained differences among the diagnostic parameters calculated by ROC curve analysis and contingency tables, except to MMP-2 and MMP-9, were not significant (p > 0.05, two-way ANOVA). The ROC curves show areas over 70% only to MMP-2 and MMP-9 (Figs. 5 and 6).
| MMP-1 | MMP-2 | MMP-8 | MMP-9 | MMP-12 | ||||||
|---|---|---|---|---|---|---|---|---|---|---|
| Carotid Stenosis Level | RR | C.I. 95% | RR | C.I. 95% | RR | C.I. 95% | RR | C.I. 95% | RR | C.I. 95% |
|
II (n=16) |
1.3 | 0.46 to 3.47 | 3.00 | 1.23 to 7.34 | 0.47 | 0.168 to 1.31 | 9.09 | 1.402 to 58.94 | 1.900 | 0.716 to 5.04 |
|
III (n=8) |
0.8 | 0.09 to 6.11 | NS | NS | 1.31 | 0.163 to 10.53 | NS | NS | NS | NS |
|
IV (n=7) |
1.8 | 0.45 to 7.04 | 3.67 | 1.11 to 12.11 | 0.56 | 0.142 to 2.23 | 7.71 | 1.185 to 50.20 | 3.556 | 0.802 to 15.75 |
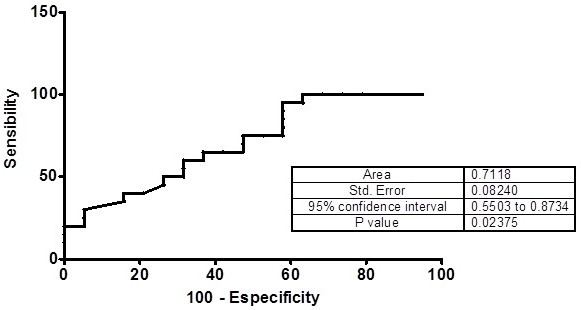
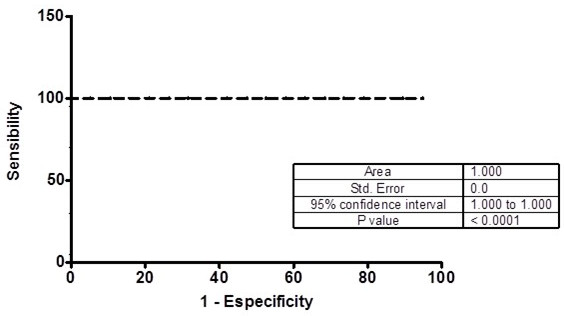

Fig. 7 shows that the zymograms (gelatin electrophoresis) had higher proteolytic activities (A) and digested area (B) from CAD than non-CAD plasma samples on the evaluated gels (One-tailed, Unpaired t test, p < 0.0001).
4. DISCUSSION
This study suggests that MMP-2 and MMP-9 optical densities are biomarkers for the presence of CAD. Previous studies have shown that elevated serum MMP-9 and MMP-2 values are associated with inflammation, swelling, injury and carotid atherosclerotic plaque rupture [4, 6, 13-16, 18, 19, 25-28]. Independently of the causuistic group, CAD and non-CAD patients, paired by age, sex and baseline diseases (e.g. diabetes, hypothyroidism, dyslipidemia, hypertension, tabagism, and sedentary lifestyle), the serum tested MMP-1, MMP-8 and MMP-12 did not show significant differences when compared to serum MMP-2 and MMP-9. Similarly, some authors argue that MMP-2, MMP-8, and MMP-9 show higher activities in carotid atherosclerotic lesions, and MMP-2, MMP-8 and MMP-9 should also be associated with plaque instability and rupture [13, 18].
In this study, lower serum levels of MMP-2 and MMP-9 were found in CAD patients. Our findings agree with evidence that MMP-9 has a protective action [10, 11, 13, 14, 18, 29, 30] against atherosclerosis. Although MMP-2 has also been implicated with CAD protection [13], some authors argue otherwise [14, 15]. According to ROC estimates in our study, high levels of MMP-9 were neither associated with CAD risk, nor were MMP-2 levels. ELISA results of MMP-2 and MMP-9 reported herein support previous observations, which also have demonstrated upregulated levels of these MMPs in samples from non-CAD patients [10, 11].
In the current study, low optical densities of serum MMP-2 were associated with a 3.0-3.7 fold CAD relative risk (carotid stenosis level classification, NASCET, II-IV), while MMP-9 low optical densities represented a high CAD relative risk. In all CAD patients’ serum, optical densities were below the ELISA established cutoff (0.1610) when compared to non-CAD. Probably, the MMP 2 and 9 CAD low serum optical densities are related to consumption by its high atherosclerotic plaque enzymatic activity.
The MMP-2 and MMP-9 high activities in CAD patients are associated with vascular remodeling, while other metalloproteinases (e.g., MMP-1, MMP-3, MMP-7, MMP-8) [13, 15] are released by atherosclerotic plaque injury. MMP-1 has a high loading in the first PC (0.89) whereas MMP-8 contributes to PC3 (-0.97), thus leading to the reasonable conclusion that the PCA might help assess patient risk due to plaque damage. Our zymogram digestion activity was carried out using 60 to 90 kDa molecular weight standards, which correspond to MMP-2 (72kDa – gelatinase-A) and MMP-9 (92kDa – gelatinase B). The zymography results showed that MMP-2 and MMP-9 had the highest enzymatic activity in CAD individuals' serum samples. The absence of MMP-2 and MMP-9 in-gel digestive activity on non-CAD samples was probably due to enzymatic inhibition by TIMP action [12]. However, in CAD samples, the high digestive activity of MMP-2 and MMP-9 was apparently related to activation and local action of MMP in atheroma plaque injury [13, 31]. It can also be inferred that the MMP activity in carotid atherosclerotic plaque is not directly proportional nor dependent on MMP serum levels, exclusively. A plethora of factors may modulate MMP activity, which may contribute to the causes of false-positive results associated with elevated levels of MMP that are not associated with the established atherosclerotic lesion. These factors include cytokines (e.g. IL6, TNF-alpha), RCP [14], TIMP, protocollagen [13, 15, 31], other MMPs (e.g. ADAMS, ADAMTS), gene expression control [9, 12] LDL particle size and HDL´s free cholesterol acceptance [15]. In addition, conditions such as dyslipidemia, hypertension and diabetes [16, 32] may modulate MMP activity. However, we must realize that the MMP activity was not investigated in situ and it may not necessarily reflect the MMP circulating behavior [18]. Therefore, further studies are necessary to investigate the relationship between MMP in situ expression/release and its plasma concentration and their inhibitors/regulators, as we know that MMP activity has a great dependence on other factors and conditions [9, 12-16, 31].
5. STUDY LIMITATIONS
The results of this study need to be read considering some limitations, because i) the cross-sectional analysis does not allow to prove causality; ii) the use of a convenience sample does also not allow generalization of our results, and finally; iii) the role of MMPs as independent biomarkers of carotid atherosclerosis severity needs to be addressed in prospective studies.
CONCLUSION
In conclusion, this study suggests that MMP-2 and MMP-9 serum optical densities, and their digestive activities, have higher relevance as assessment risk markers of established clinical carotid artery disease than the other MMPS evaluated. Further studies are necessary to prove the role of MMP-2 and MMP-9 as biomarkers of CAD presence and clinical course.
FUTURE INVESTIGATIONS
We are preparing a large-scale study to prove the role of MMP-2 and MMP-9 as CAD biomarkers, by evaluating the behavior of MMP inhibitors/regulators relationship into the tissue microvascular environment (in situ) and plasma activities.
ETHICS APPROVAL AND CONSENT TO PARTICIPATE
The study was approved by the Federal University of Bahia´s human research ethics committee – (CEP/MCO/UFBA 09/2005-2016).
HUMAN AND ANIMAL RIGHTS
No Animals were used in this research. All human research procedures followed were in accordance with the ethical standards of the committee responsible for human experimentation (institutional and national), and with the Helsinki Declaration of 1975, as revised in 2013.
CONSENT FOR PUBLICATION
All participants signed a free informed consent.
AVAILABILITY OF DATA AND MATERIALS
Not applicable.
FUNDING
We thank to CNPq, CAPES, FAPESB, and FIOCRUZ, for the financial grants and infrastructural support, respectively. Álvaro Luis Müller da Fonseca was a recipient of a fellowship from CpQGM-FIOCRUZ, Bahia, Brazil.
CONFLICT OF INTERESTS
The authors declare no conflict of interest, financial or otherwise.
ACKNOWLEDGEMENTS
We thank Silvia Oliveira for SDS-PAGE technical support, and we are grateful to Dr. Lain Pontes de Carvalho for the mentoring and friendlily teaching.


