All published articles of this journal are available on ScienceDirect.

Red Blood Cell Distribution Width as a Diagnostic Marker of Hepatocellular Carcinoma in Cirrhotic Patients
Abstract
Background and Aim
Although α-fetoprotein (AFP) is the main marker used for the diagnosis of hepatocellular carcinoma(HCC), its sensitivity and specificity as a screening tool have been questionable. Red blood cell distribution width (RDW) has been involved as a prognostic tool for many diseases and cancers including liver diseases. Still, its role in the diagnosis of HCC needs to be identified. This study aimed to evaluate the clinical importance of RDW as a novel marker in the diagnosis of HCC in Egyptian cirrhotic patients.
Patients and Methods
This cross-sectional study was carried out on 162 cirrhotic patients who attended Tropical medicine department clinics and inpatient wards at the Faculty of Medicine, Tanta University. Then they were divided into 2 groups of 81 patients each depending on their diagnosis with or without HCC (group I and group II respectively). Complete blood picture (CBC) that included red cell distribution width- coefficient of variation (RDW-CV) and AFP were obtained from all patients.
Results
There was a statistically significant elevation in RDW-CV in the HCC group as its mean± SD was 15.2.± 1.86 in HCC group versus 13.8 ± 1.99 in non HCC group (P<0.001). In addition, AFP was significantly elevated in group I than in group II (P<0.001). RDW-CV at a cut–off >14% had a 66.76%sensitivity and 61.73%specificity while AFP at a cut-off value>20 ng/ml had a 60.49%sensitivity and 79.01%specificity in the diagnosis of HCC. The combination of RDW-CV and AFP increased the sensitivity and specificity for the diagnosis of HCC(72.84% and 87.65% respectively) than each marker alone.
Conclusions
RDW may be considered a novel and cheap biomarker for the diagnosis of HCC either alone or in combination with AFP as it is readily available in CBC and does not need sophisticated techniques.
1. INTRODUCTION
HCC is the 6th most prevalent tumor worldwide and the 2nd leading cause of cancer-related fatalities [1]. In Egypt, different studies have shown that the prevalence of HCC in cirrhotic patients ranges is between 20.03% and 21% [2, 3]. Despite the stunning advances in HCC treatment only 20% or less of patients diagnosed with HCC benefit from radical surgical resection owing to the high degree of the tumor, rapid infiltrating growth, and early metastasis [4].
AFP is the main marker used for the diagnosis of HCC, yet its sensitivity and specificity as a screening tool have been questionable [5]. As low levels (<100 ng/mL) are less specific for diagnosing HCC as slightly increased AFP levels can be detected in patients with chronic hepatitis [6]. In addition, normal AFP levels were observed in patients confirmed to have HCC [6-8]. So many studies have been conducted to find new markers for either the diagnosis or prognosis of HCC that can evade these drawbacks [9-11].
RDW is an artificially generated parameter usually included in the report of a complete blood picture (CBC) that measures red blood cell changeability in peripheral blood (i.e., anisocytosis) [12], with a reference range ranging from 11% to 14% [13]. The importance of RDW assessment is more than the determination of the cause of anemia [12, 14], as it was found to have a role as a prognostic indicator in different illnesses including sepsis [15], acute myocardial infarction [16], heart failure [17], autoimmune disorders [18] and liver diseases [19]. In addition, higher RDW values were related to elevated mortality in the general population [20], but the explanation for this finding still needs to be identified. Also, the role of RDW as a prognostic marker in different types of cancers has been studied [21].
The relation between changes in values of RDW and both HCC development and prognosis had been postulated in previous studies. The role of RDW as a sole marker for the diagnosis of HCC is still questionable and needs further studies to be identified [22].
The aim of this study was to assess the role of RDW as a cheap readily available diagnostic marker of HCC in Egyptian cirrhotic patients compared to standard α-fetoprotein.
2. METHODOLOGY
2.1. Patients and Methods
In this cross-sectional study, the laboratory data of 236 patients who attended Tropical medicine and infectious diseases department clinics and inpatients wards, at Tanta university hospitals were assessed for enrollment just after obtaining institutional ethical approval (approval code: 35370/3/22) and following the provisions of ethical guidelines of the 1975 declaration of Helsinki starting from April 2022. 162 patients who met our inclusion criteria (i.e. Male or female patients ≥18 years diagnosed with cirrhotic liver with and without HCC) were enrolled while the rest of the patients were excluded as they had one or more of the following; anemia either microcytic hypochromic or macrocytic, metabolic syndrome, renal impairment, malignant diseases other than liver cancer, history of blood transfusion during the last four months, or patients who refused to participate in this study.
Furthermore, the included patients were divided into two groups: Group I included 81 patients who had liver cirrhosis and HCC and Group II included 81 patients who had only liver cirrhosis.
Informed consent was obtained from all of the included patients and detailed history and full clinical examination were conducted. All blood samples were obtained under a complete aseptic technique and sent for the assessment of CBC using an automatic hematology analyzer. The evaluated parameters included; white blood cell count (WBC), hemoglobin (Hb), platelet count (PLT), and RDW. Biochemical parameters were done and included a complete liver profile (total bilirubin, serum albumin, alanine aminotransferase (ALT), aspartate aminotransferase (AST), coagulation profile (INR), serum creatinine, and AFP.
For the diagnosis of cirrhosis and HCC, all included patients had ultrasonography examination on the abdomen and pelvis for the detection of liver; size, echogenicity, vasculature, and assessment of the existence of focal lesions if any, in addition to measuring splenic size, and detecting presence of ascites using Toshiba Nemio XG Ultrasound using a 3.5 Hz convex probe. Then patients in whom focal lesions were detected were scheduled for Triphasic CT (with intravenous contrast) for confirmation of the typical criteria of HCC by the study of its pattern of enhancement (arterial phase hypervascularity and venous or delayed phase washout), and the detection of location, size and number of focal lesions and patency of portal vein.
2.2. Statistical Analysis of the Data
Data were fed to the computer and analyzed using IBM SPSS software package version 20.0. (Armonk, NY: IBM Corp). Categorical data were represented as numbers and percentages. The chi-square test was applied to compare between two groups. Alternatively, the Monte Carlo correction test was applied when more than 20% of the cells were expected to have a count less than 5. Continuous data were expressed as a range (minimum and maximum), mean, standard deviation, and median for normally distributed quantitative variables, and a Student t-test was used to compare the two groups. When data were not normally distributed quantitative variables the Mann-Whitney test was used. Pearson coefficient was used to correlate between two normally distributed quantitative variables. For the evaluation of the diagnostic performance of the used tests Receiver operating characteristic curve (ROC) was used and the area under the ROC curve denotes the diagnostic performance and allows for the comparison of performance between the two tests. Data were considered significant when P value ≤ 0.05.
3. RESULTS
This study included 162 patients who were categorized into 2 groups: Group I included 81 patients diagnosed with liver cirrhosis and HCC while Group II included 81 cirrhotic patients without confirmed HCC.
The demographic data of the two studied groups showed a significant elevation in the age in the HCC group (P<0.001), also there was a significant difference in sex between studied groups (P=0.031) as the majority of patients were males as shown in Table 1.
As regards CBC there was a statistically significant elevation in RDW-CV in the HCC group as its mean± SD was 15.2.± 1.86 in the HCC group while it was 13.8 ± 1.99 in non-HCC group (P<0.001), while Hemoglobin percent, WBCs, and platelet counts showed no significant differences among studied groups (P= 0.933, 0.153, 0.743 respectively) (Table 1).
Regarding biochemical parameters, there was a significant decrease in serum albumin level in the HCC group (P=0.001), while total bilirubin, ALT, AST, and INR levels were significantly increased in the HCC group (P=0.009,<0.001, 0.003, 0.013 respectively).In addition, AFP was significantly elevated in group I than in group II (P<0.001). While creatinine level showed no significant difference among studied groups (P=0.073) as shown in Table 1.
Regarding the ultrasound findings, all included patients had the radiological criteria of the cirrhotic liver, and a significant number of patients in group I had ascites as 46.9% of patients had no ascites in group I versus 70.4% in group II(MCP=0.014), then patients who had ascites were divided as regard amount of ascites into mild, moderate and marked that was (25.9%, 23.5% and 3.7% in group I versus 16%, 9.9% and 3.7% in group II respectively). The spleen was enlarged in 58 patients in the HCC group (71.6%) and in 50 patients in non HCC group (61.7%), while 6.2% of patients in the HCC group had splenectomy with no significant difference among studies groups (P= 0.060)as illustrated in Table 1.
As regards to the number and size of focal lesions (FLs) in Triphasic CT, 53 patients had single FL, while 9 patients had 2 FLs and 19 patients had > 2 FLs. While 20 patients (24.7%) had FL sizes less than 3 cm, 3-5 cm in 34 patients (42%), and more than 5 cm in 27 patients (33.3%). FLs were located in the right lobe of the liver in 53 patients, and in the left lobe in 17 patients, and in bipolar in 11 patients. Finally, 68 patients had patent portal veins while it was thrombosed in 13 patients as shown in Table 2.
| - |
Group I (n=81) |
Group II (n=81) |
P value |
|---|---|---|---|
|
Age(years) Mean ± SD. |
61.5 ± 6.14 | 57.6 ± 7.39 | <0.001* |
|
Sex (n%) Male Female |
60(74.1%) 21(25.9%) |
47 (58.0%) 34(42.0%) |
0.031* |
|
HB(g/dl) Mean ± SD |
12.63 ± 1.3 | 12.6 ± 1.4 | 0.933 |
|
WBCs(×103/ul) Median(Min.-Max) |
5.04 (2.02 – 12.8) | 5 (1.66 – 12) | 0.153 |
|
Platelets(×103/ul) Median (Min. – Max.) |
163(44 – 414) | 157(50 – 450) | 0.743 |
|
RDW-CV (%) Mean ± SD. |
15.2 ± 1.86 | 13.8 ± 1.99 | <0.001* |
|
AFP (ng/ml) Median (Min. – Max.) |
25 (2 – 8000) | 4.73 (1.40 – 74) | <0.001* |
|
ALT)u/l) Mean± SD |
38 (9 – 233) | 27 (4– 90) | <0.001* |
|
AST(u/l) Median (Min. – Max.) |
45 (12.9 – 243) | 33 (8 – 97) | 0.003* |
|
INR Median (Min. – Max.) |
1.13 (1.0 – 2.0) | 1.05 (1– 1.90) | 0.013* |
|
Albumin(g/dl) Median (Min. – Max.) |
3.4 (2.1 – 5) | 4(1.4 – 4.8) | 0.001* |
|
Total bilirubin (mg/dl) Median (Min. – Max.) |
1.12 (0.25 – 2.90) | 0.90 (0.34 – 4.10) | 0.009* |
|
Creatinine (mg/dl) Median(Min.-Max) |
0.82 (0.54 – 1.40) | 0.80 (0.5 – 1.40) | 0.073 |
| US | - | - | - |
|
Spleen Normal Enlarged Splenectomy |
18 (22.2%) 58 (71.6%) 5 (6.2%) |
30 (37.0%) 50 (61.7%) 1 (1.2%) |
MCp= 0.060 |
|
Ascites Absent Mild Moderate Marked |
38 (46.9%) 21 (25.9%) 19 (23.5%) 3 (3.7%) |
57 (70.4%) 13 (16.0%) 8 (9.9%) 3 (3.7%) |
MCp= 0 .014* |
| Characters of FLs in Triphasic CT | Number of patients (%) |
|---|---|
| Number of FLs | |
| 1 2 >2 |
53 (65.4%) 9 (11.1%) 19 (23.5%) |
| Size of FLs (cm) | |
| <3 3-5 >5 |
20 (24.7) 34 (42) 27 (33.3) |
| Site of FLs | |
| RT lobe LT lobe Bilobar |
53 (65.4%) 17 (21.0%) 11 (13.6%) |
| PV | - |
| Patent | 68 (84.0%) |
| Thrombosed | 13 (16.0%) |
RT lobe: right lobe, LT lobe: left lobe, PV: Portal vein.
| - | RDW-CV | |
|---|---|---|
| - | R | P |
| Size of FL in CT | -0.047 | 0.679 |
| - | AUC | p | 95% C.I | Cut off |
Sensitivity % |
Specificity % |
PPV % |
NPV % |
|---|---|---|---|---|---|---|---|---|
| RDW-CV | 0.744 | <0.001* | 0.668 – 0.819 | >14 | 66.67 | 61.73 | 63.5 | 64.9 |
| AFP | 0.753 | <0.001* | 0.679 -0.828 | >20 | 60.49 | 79.01 | 74.2 | 66.7 |
| Combined (RDW-CV + AFP) | 0.838 | <0.001* | 0.775 – 0.901 | - | 72.84 | 87.65 | 85.51 | 76.34 |
There was no significant correlation between RDW and the size of the focal lesion (P=0.679) (Table 3).
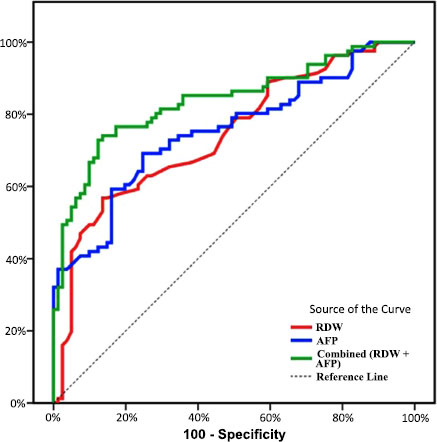
ROC curve analysis showed that RDW-CV at a cut-off>14% had the ability to distinguish HCC from non-HCC with sensitivity 66.76%, specificity 61.73%, PPV 63.5%, and NPV 64.9%. While AFP at cut-off value>20 ng/ml had the ability to discriminate HCC from non-HCC with a sensitivity of 60.49%, specificity of 79.01%, PPV 74.2, NPV 66.7% (Table 4 and Fig. 1).
Furthermore, multivariate binary logistic regression analysis was used to evaluate the summed diagnostic ability of RDW and AFP. We found that the combination of RDW and AFP led to increased sensitivity and specificity (72.84% and 87.65% respectively) than each marker alone (Table 4).
4. DISCUSSION
Based on previous reports questioned the value of AFP in the surveillance for HCC due to decreased sensitivity, as cirrhotic patients might have fluctuating levels of AFP that may be attributed to HCV or HBV infection flare, deterioration of underlying liver disease, or the development of HCC [23]. In addition, it was found that only 10-20% of HCCs present with abnormal AFP during early stages [24-26].
So this raised the need to search for another marker that can be used for the diagnosis of HCC either alone or in combination with AFP. In this cross-sectional study, we aimed to assess the value of RDW as a diagnostic marker of HCC.
Age was significantly increased in the HCC group and male sex predominates in both groups. In accordance with this result, previous studies have confirmed that males at risk are more susceptible to developing HCC than females [2, 27].In addition, previous studies concluded that HCC incidence increased in males aged more than 50 years [28,29]. Different explanations have been established including; increased exposure of males to environmental carcinogens, sex hormones, and elevated DNA synthetic activity in male patients diagnosed with liver cirrhosis when compared to female patients [30].
RDW has been assessed as a diagnostic and a prognostic tool in different malignancies and the mechanism of its affection in these conditions can be attributed to chronic inflammation as inflammation causes ineffective erythropoiesis, which in turn causes a defect in RBC production finally leading to elevated RDW [31-33]. This can explain the proposed mechanism of RDW elevation in HCC patients as their liver disease can be caused by various factors such as viral infections, alcoholism, and iron or copper overload which in turn cause a prolonged inflammation in the liver tissue representing a pre-cancerous environment [34].
Most of the previous studies had focused on the role of RDW as a prognostic marker in HCC and they found a close relation between elevated RDW and survival rates in HCC patients [35, 36]. This study focused mainly on the assessment of the RDW's role as an early diagnostic marker of HCC. When we compared the RDW values among cirrhotic patients with and without HCC a significant increase in RDW in the HCC group was found suggesting its ability to diagnose HCC. In accordance with our results, a previous study concluded that treatment-naive HCC patients had higher admission RDW when compared to healthy controls [19]. In this study, no relation was found between RDW values and tumor size. This was opposite to the earlier study conducted by Zhao et al. as they found an association between RDW and tumor stage and size [37], this difference can be attributed to the different nature of selected patients as they included only patients who were candidates for radical resection of their tumors, this was not the same in our study as we included patients with criteria of HCC i.e either a candidate for radical resection or to any type of intervention.
Two different cutoff values of RDW-CV were assessed and as the value of RDW-CV increases its sensitivity decreases, which was a similar problem in the utility of AFP, but it was found to have a positive additive effect when combined with AFP as it improves both its sensitivity and specificity.
However, the utilization of RDW in cirrhotic patients has some limitations as its level is affected by many factors that hepatic patients are prone to develop one or more of them including malnutrition, suppression of bone marrow, erythropoietin use, thyroid function abnormalities, deficiency of iron or vitamin B12, or cardiovascular disease. All this may decrease its specificity as a diagnostic marker [38]. One of the limitations of this study is the small number of HCC patients as we could not include all patients assessed for enrollment due to our exclusion criteria so further studies with a larger number of included patients are required. In addition, we did not assess the role of RDW as a prognostic marker in those patients.
CONCLUSION
Keeping in mind the limitations of using RDW in cirrhotic patients, it may be considered a cheap biomarker for the diagnosis of HCC either alone or in combination with AFP by increasing its sensitivity and specificity as it is readily available in complete blood picture and does not need a sophisticated technique.
LIST OF ABBREVIATIONS
| HCC | Hepatocellular carcinoma |
| AFP | α-fetoprotein |
| RDW | Red blood cell distribution width |
| RDW-CV | Red cell distribution width- coefficient of variation |
| CBC | Complete blood count |
| MSCT | Multislicetriphasic CT |
| FL | Focal lesion |
| PV | Portal vein |
| Hb | Hemoglobin concentration |
| WBCs | White blood cells |
| ALT | Alanine aminotransferase |
| AST | Aspartate aminotransferase |
| INR | International Normalized Ratio |
| US | Ultrasound |
| SD | Standard deviation |
| ROC Curve | Receiver operating characteristic curve |
ETHICS APPROVAL AND CONSENT TO PARTICIPATE
Tanta University hospitals were assessed for enrollment just after obtaining institutional ethical approval (approval code: 35370/3/22).
HUMAN AND ANIMAL RIGHTS
No animals were used in this research. All procedures performed in studies involving human participants were in accordance with the ethical standards of institutional and/or research committee and with the 1975 Declaration of Helsinki, starting from april 2022.
CONSENT FOR PUBLICATION
Informed consent was obtained from all participants.
STANDARDS OF REPORTING
STROBE guidelines were followed.
AVAILABILITY OF DATA AND MATERIALS
The data generated and analyzed during the current study are not publically available but are available from the corresponding author [S.M] on a reasonable request
FUNDING
None.
CONFLICT OF INTEREST
The authors declare no conflict of interest financial or otherwise.
ACKNOWLEDGEMENTS
Declared none.