All published articles of this journal are available on ScienceDirect.

Diagnostic Accuracy of Red Cell Distribution Width to Platelet Ratio for Detection of Liver Fibrosis Compared with Fibroscan in Chronic Hepatitis B Egyptian patients
Authors Info & Affiliations
Abstract
Background and Aims:
The decision to treat chronic hepatitis B Virus infection (CHB) may necessitate an assessment of the degree of liver fibrosis. Guidelines recommend Fibroscan examination in such cases. However, it is costly and not widely available. Red cell distribution width (RDW) and platelet count are simple parameters obtained from the blood pictures; and their ratio RDW to platelet ratio (RPR) was claimed to correlate with liver fibrosis. We aimed to assess the ability of RPR to replace the costly fibroscan in the detection of significant fibrosis in chronic hepatitis B patients.
Patients and Methods:
This cross-sectional study was conducted in the Tropical medicine department, Tanta University, Egypt, between December 2018 and September 2019. One hundred and twenty-five patients with CHB were included and divided according to the fibroscan examination into: Group I: patients with no significant fibrosis (n=66), Group II: patients with significant (≥ F2) fibrosis (n=59). RPR was calculated for all patients and tested against Fibroscan results.
Results:
Both groups were matched in regards to age, sex, viral load, and steatosis. There was a significant positive correlation between the degree of stiffness measured by FibroScan in patients with a significant degree of fibrosis and serum bilirubin, a quantitative polymerase chain reaction of hepatitis B virus DNA (HBV DNA PCR), and fibrosis-4 score (FIB-4 score) (P value= 0.020, 0.049, and 0.0402, respectively). However, RPR was not correlated to the degree of fibrosis in fibroscan examination.
Conclusions:
The accuracy of RDW to platelet ratio (RPR) for the detection of fibrosis in CHB patients is questionable. FIB-4 is correlated with liver stiffness measurement (LSM) in patients with significant fibrosis (F2 or more). Neither RPR, AST to Platelet Ratio Index (APRI) or FIB4 can replace fibroscan for grading of fibrosis in CHB patients for evaluation to start therapy.
1. INTRODUCTION
Hepatitis B virus (HBV) is one of the most important viruses causing chronic liver inflammation, which in turn hastens the risk of end-stage liver disease and liver cancer [1]. In Egypt, HBV prevalence is 1.4% among adults aged between 15-59 years [2].
The management strategy and time to start therapy in patients with chronic HBV infection (CHB) depend on three factors; the clinical status of the patient, laboratory liver profile, and the degree of liver fibrosis [3]. Although liver biopsy is the gold standard for estimating liver pathology, it has the drawbacks of invasive maneuvers such as pain and risk of bleeding [4].This raised the concept of non-invasive methods for assessing liver fibrosis, either radiological or laboratory.
Transient elastogram (Fibroscan) is adopted by EASL2017 HBV treatment guidelines as a standard investigation for significant fibrosis, which necessitates treatment (≥f2) [3]. It can also diagnose fatty liver and cirrhosis, which commonly exist alongside chronic viral hepatitis [5]. However, FibroScan is an expensive device that requires trained personnel and is not widely available.
Red blood cell distribution width (RDW), RDW corpuscular volume (RDW-CV), and RDW standard deviation (RDW-SD) are the measures of the range of variation of red blood cells (RBCs) volume that is routinely measured as a part of regular complete blood count [6]. They have been described as predictive markers in several conditions, including coronary artery disease, congestive heart failure [7], cerebrovascular accidents [8], pulmonary hypertension [9], and peripheral artery disease [10].
RDW was found to correlate with liver fibrosis degree and associated with poor short-term outcomes in patients suffering from HBV [11]. In addition, RDW to platelet ratio (RPR) was proposed as a significant predictor of fibrosis and cirrhosis in patients with chronic hepatitis [12].
This study aimed to assess the ability of RPR to predict significant fibrosis in chronic hepatitis B patients and to compare its accuracy with FibroScan results.
2. MATERIALS AND METHODS
This cross-sectional study was conducted in the Tropical medicine department, Tanta University, Egypt, in the period from December 2018 to September 2019. The study was approved by Tanta University Ethical Committee (approval code 32996/03/19).
Treatment naive male or female patients, 18 years or older, with chronic HBV infection documented by positive HBsAg for more than 6 months and detectable HBV DNA were eligible to share in the study. Patients suffering from; hepatitis C virus co-infection, anemia (either microcytic, hypochromic, or macrocytic), thrombocytosis, thrombocytopenia, metabolic syndrome, blood transfusion 4 months prior to the examination, renal impairment, malignant disease other than liver cancer or unwillingness to participate in the study were excluded.
From a total of 151 patients screened to participate in the study; 125 patients who met the criteria and signed informed consent to take part in this study were enrolled.
All patients had been subjected to the following: Full history taking, complete physical examination, routine laboratory investigations including; liver function tests: Alanine transaminase (ALT), aspartate transaminase (AST), serum albumin, total and direct serum bilirubin, Prothrombin time & activity, and international normalized ratio (INR), serology for HBV and Hepatitis C virus and Complete blood count (CBC). CBC analyses were performed automatically using Erma PCE-210 hematology analyzer to show the following indices: Hemoglobin level, red cell distribution width (RDW), white blood cells (WBCs) count, and platelet count.
The following scores were calculated:
- Fibrosis-4 score (FIB-4) = (age [yr]x AST [U/L]) / ((PLT [109/L]) x (√ALT [U/L])) [13].
- AST to Platelet Ratio Index (APRI) = AST (IU/L) / AST upper normal limit (IU/L) /Platelet count (109/L) x 100 [14].
- RDW/ platelet ratio
2.1. Radiological Investigations Including
Ultrasound of the abdomen and pelvis was performed using Toshiba Nemio XG device with a convex probe 3.5 MHz using (B-mode) for the assessment of liver (echogenicity surface nodularity, edge, periportal fibrosis and narrowing of intrahepatic vessels), size of spleen and presence of other abnormal findings as ascites.
- Transient elastography (FibroScan) was performed using Fibroscan (echosens- France) 502; with M or XL probes, according to BMI of the patient. It was performed by experienced operators following the instructions of the manufacturer, for the detection of stiffness and steatosis results [15].
- FibroScan examination and blood samples were done on the same day.
All authors had access to the data of the study, and all had reviewed and approved the final edition of this paper.
3. Statistical Analysis
Data were analyzed using IBM SPSS software package version 25 (IBM©, Armonk, NY: USA). The data were summarized as median, and inter quartile range or mean and standard deviation (SD) according to their distribution normality for quantitative variables, and percent for qualitative variables. Comparison between quantitative values was made using the unpaired Student t-test or Mann Whitney test. The Correlation coefficient was determined by Spearman's rank correlation. Receiver Operating Characteristic curve (ROC-curve) analysis was used to assess the overall diagnostic performance of each test at optimal cut-off values compared to fibroscan. Sensitivity, specificity, positive and negative predictive values were calculated accordingly. For all used tests, the results were considered statistically significant when p <0.05.
4. RESULTS
Patients included in this study were 125; (90 males and 35 females). They were categorized according to liver stiffness measured by FibroScan into two groups:
Group Ι: included 66 patients with no significant hepatic fibrosis degree (F0-F1).
Group II: included 59 patients with significant hepatic fibrosis degree (≥ F2).
Both groups were matched regarding age and sex (P = 0.57 and 0.42, respectively). There was no significant difference between both studied groups as regarded laboratory tests except for hemoglobin and INR as they were significantly increased in group II than group I (P = 0.044 and 0.03 respectively) (Table 1).
| - |
Group I F0-F1 (n = 66) |
Group II ≥ F2 (n = 59) |
P value | |
| Age (years) | Median | 40.5 | 40 | 0.57 |
| q1-q3 | 31-50 | 35-50 | ||
| Sex | Males no (%) | 45 (68.18%) | 45 (76.27%) | 0.42 |
| Females no (%) | 21 (31.82%) | 14 (23.73%) | ||
| Hemoglobin(g/dl) | mean± SD | 13.353± 1.21 | 13.785±1.150 | 0.044* |
| RDW | Median | 14.15 | 14.2 | 0.863 |
| q1-q3 | 13.7-14.9 | 13.625-14.7 | ||
|
Platelets (103/mm3) |
Median | 218 | 217 | 0.68 |
| q1-q3 | 190-249 | 17-252 | ||
|
WBCs (103/mm3) |
Median | 5.65 | 5.4 | 0.405 |
| q1-q3 | 5.-6.3 | 4.3-7.4 | ||
| ALT (mg/dL) | Median | 26.5 | 29 | 0.191 |
| q1-q3 | 22- 31 | 20.25- 39.75 | ||
| AST (mg/dL) | Median | 29.5 | 30 | 0.429 |
| q1-q3 | 23 – 35 | 24 – 37 | ||
|
Bilirubin (mg/dL) |
Median | 0.85 | 0.8 | 0.986 |
| q1-q3 | 0.65-0.94 | 0.662-1.008 | ||
|
Albumin (mg/dL) |
Mean | 4.206 | 4.362 | 0.091 |
| SD | 0.433 | 0.584 | ||
| INR | Median | 1.03 | 1.07 | 0.03* |
| q1-q3 | 1.01- 1.09 | 1.01-1.148 | ||
|
Creatinine (mg/dL) |
Median | 0.9 | 1 | 0.105 |
| q1-q3 | 0.8-1.01 | 0.815-1.138 | ||
|
Urea (mg/dL) |
Median | 28 | 25 | 0.111 |
| q1-q3 | 24-33 | 22-33 | ||
| PCR | Median | 798 | 457 | 0.148 |
| q1-q3 | 320-2100 | 20-3052 | ||
| FIB-4 | Median | 1.02 | 1.1 | 0.134 |
| q1-q3 | 0.76-1.37 | 0.76-1.763 | ||
| APRI | Median | 0.327 | 0.365 | 0.111 |
| q1-q3 | 0.264-0.405 | 0.276-0.491 | ||
| RDW/PLAT | mean± SD | 0.067 ±0.016 | 0.069 ±0.018 | 0.554 |
| LSM | Median | 4.9 | 9 | <0.001 |
| q1-q3 | 4.3-5.6 | 8-11.4 | ||
| CAP | mean± SD | 232.6 ± 58.13 | 226.97 ± 46.63 | 0.611 |
Abbreviations: CAP, controlled attenuation parameter; RDW, red cell distribution width; WBCs, white blood cells; ALT, alanine aminotransferase; AST, aspartate aminotransferase; INR, international normalized ratio; PCR, polymerase chain reaction; FIB-4, fibrosis-4 index; APRI, AST to platelet ratio index; PLAT, platelets; LSM, liver stiffness measurement.
| - | Hepatic Fibrosis (LSM) | |||
|---|---|---|---|---|
|
Group I F0-F1 (n=66) |
Group II ≥ F2 (n=59) |
|||
| R | P value | R | P value | |
| Age | 0.0394 | 0.753 | 0.206 | 0.118 |
| ALT | 0.180 | 0.148 | 0.12 | 0.364 |
| AST | 0.105 | 0.230 | 0.14 | 0.288 |
| Albumin | -0.015 | 0.404 | -0.117 | 0.376 |
| Bilirubin | 0.232 | 0.0609 | 0.303 | 0.0200* |
| PT | 0.189 | 0.128 | 0.0396 | 0.765 |
| Creatinine | -0.0948 | 0.449 | 0.0393 | 0.767 |
| Platelet | -0.065 | 0.604 | -0.209 | 0.112 |
| WBCs | -0.0581 | 0.643 | 0.0736 | 0.578 |
| Hb | 0.206 | 0.0978 | -0161 | 0.221 |
| RDW | 0.00685 | 0.584 | 0.159 | 0.229 |
| PCR | -0.0604 | 0.632 | 0.382 | 0.0049* |
| APRI | 0.119 | 0.341 | 0.164 | 0.213 |
| FIB-4 | 0.0574 | 0.646 | 0.268 | 0.0402* |
| RDW/PLAT | -0.0541 | 0.668 | 0.227 | 0.0883 |
| CAP | 0.0548 | 0.661 | 0.24 | 0.0666 |
Abbreviations: ALT, alanine aminotransferase; AST, aspartate aminotransferase; PT, prothrombin time; WBCs, white blood cells; Hb, hemoglobin; RDW, red cell distribution width; PCR, polymerase chain reaction; APRI, AST to platelet ratio index; FIB-4, fibrosis-4 index; PLAT, platelets; CAP, controlled attenuation parameter.
Calculated scores (RPR, FIB-4, and APRI) did not show any significant difference between the studied groups (P = 0.554, 0.134, and 0.111, respectively) (Table 1).
There was no significant correlation between the degree of stiffness in patients with non-significant fibrosis and all other studied parameters (Table 2), while there was a significant positive correlation between the degree of liver stiffness measured by FibroScan in patients with a significant degree of fibrosis and: serum bilirubin, PCR, and FIB-4 score (P value= 0.0200, 0.049, and 0.0402 respectively) (Table 2).
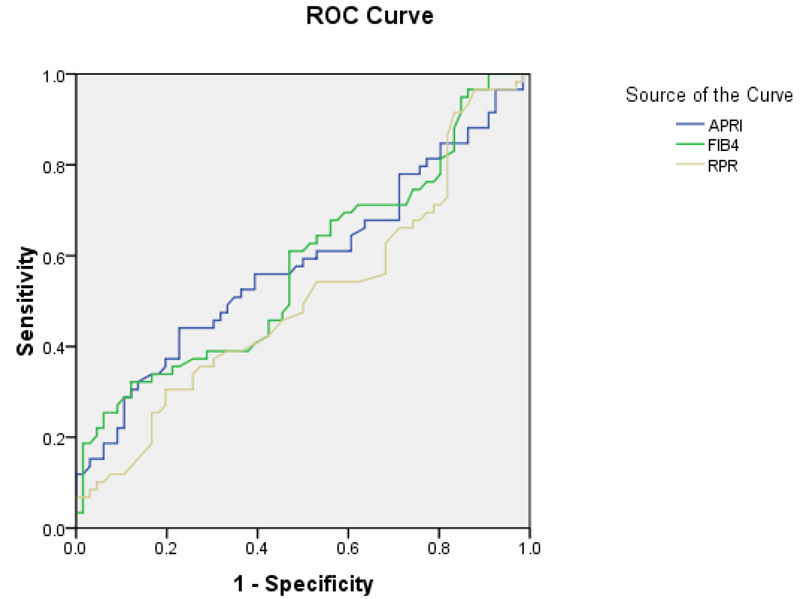
At cut-off ≥ 1.76, FIB-4 has the ability to predict fibrosis with 29.58% sensitivity, 91.14% specificity, 75% PPV, and 59% NPV (AUC= 0.573) (Table 3, Fig. 1).
| Test | AUC | P value | 95%CI |
|---|---|---|---|
| APRI | 0.583 | 0.11 | 0.481-0.685 |
| FIB4 | 0.578 | 0.13 | 0.476-0.680 |
| RPR | 0.509 | 0.87 | 0.406-0.612 |
5. DISCUSSION
We aimed in the present study to identify the ability of RPR to detect significant liver fibrosis in patients with chronic hepatitis B infection. There was no significant difference regarding age and sex among the two studied patient groups. This was in partial similarity to the results of Liu et al. and Huang et al. [16, 17], who did not find a significant difference in sex among their studied patients, but they concluded that the severity of fibrosis tended to increase significantly with increasing of age.
It is even logical that the more the age of the patient, the longer the course of infection and, subsequently, the more the pathology. However, this difference in our results can be attributed to the high prevalence of HBV infection in South East Asia, where these studies were conducted, which was reflected in the wider scale of age group included (ranging between 18-70 years). Younger and older patients included in those studies allow the significant difference in age to be elicited, while Egypt has an intermediate prevalence of HBV [18].
As regards laboratory investigations, INR was statistically increased in group II than in group Ι. This can be attributed to the higher degree of liver fibrosis in group II. Our explanation is based on previous studies that include INR in the scoring of advanced fibrosis and cirrhosis in hepatitis [19, 20].
According to Chen et al. [21] hemoglobin was negatively correlated to significant fibrosis and cirrhosis. This was not in accordance with our results, where hemoglobin was significantly higher in group II than in group Ι. Considering the fact that all patients with microcytic hypochromic anemia were excluded from our study to avoid RDW biased results; this contradiction seems explained by the different populations included in the studies.
Moreover, both groups in our study had their mean hemoglobin values in the normal range (13.4 and 13.8gm/dL), rendering this statistically significant difference of little if any clinical value.
In our study, total bilirubin was positively correlated with liver stiffness measured by fibroscan in patients with significant fibrosis.This was similar to the cross-sectional study performed by Li and Zhou on CHB patients [22].
Contrary to our results, Tubung et al. [23] reported that there was a negative correlation between bilirubin and the degree of fibrosis in their patients. This difference may be attributed to the nature of the patients included in their study, as they included patients with different etiologies of liver cirrhosis, including chronic hepatitis B and or C, alcoholic liver disease and non-alcoholic steatohepatitis.
There was a significant positive correlation between viral load (determined by quantitative PCR for HBV DNA) and liver fibrosis (determined by LSM in KPa)in patients with significant fibrosis. In agreement with our findings, previous studies conducted by Wong et al. [24] and Wang et al. [25] reported that the HBV DNA levels positively correlated with the degree of fibrosis.
Another study done by Liu et al. [16] showed contradictory results regarding the correlation between viral load and fibrosis. They concluded that HBV DNA levels showed significant differences between patients with different grades of fibrosis (mild fibrosis, severe fibrosis, and cirrhosis) in the HBeAg-positive group. However, they also found that HBV DNA levels decreased significantly with the severity of pathological changes in liver tissue. Contrary to our results, we found a positive correlation with severe fibrosis, but not mild fibrosis. This difference may be due to the different populations of studies, as their findings were observed in HBeAg-positive patients and cannot be generalized to all HBV patients.
APRI and FIB-4 were mostly used in HCV infection patients, but they had conflicting results for predicting fibrosis in patients with HBV infection [23]. We tested different scoring systems which have the potential to be surrogate markers for detecting fibrosis, such as FIB4, APRI, and RDW/Platelet ratio (RPR).
Only FIB-4 was positively correlated with the degree of liver stiffness measured (LSM) by FibroScan in group II.
In accordance with our results, Tubung et al. [23] reported that there was a significant positive correlation between the degree of fibrosis measured by Fibroscan and the FIB-4 score. Moreover, Li et al. [22] reported that FIB-4 at cut-off 1.8 had 46% sensitivity and 90% specificity for predicting fibrosis (F3-F4). In addition, a meta-analysis performed on 71 studies concluded that APRI had lower performance than FIB-4, transient elastography (TE) and Fibro Test in both HBV and HCV patients [26]. A recent study conducted by Yang et al. in 2020 concluded that; APRI and FIB-4 were an efficient tool for assessing liver fibrosis in CHB patients, and they put higher FIB-4 cut-off values (4.68, 5.76, 7.83) to predict fibrosis > F1, F2, F3 respectively with lower sensitivity (60.63%) and specificity 65.56% than our study. However, they found that FibroScan has a superior ability to assess liver fibrosis than serum biomarkers [27].
Huang et al. [16] found that APRI and FIB-4 had the ability to predict significant fibrosis and cirrhosis (F ≥ 2) with high sensitivity (81.6%) and specificity (80.4%). In partial agreement with our results, Lemoine et al. [28] studied the ability of APRI and FIB-4 to differentiate between significant fibrosis ≥ F2 and cirrhosis (F4). They found that APRI and FIB-4 were significantly increased in higher stages of liver fibrosis, and they can predict significant fibrosis in chronic HB patients. However, they reported that the APRI score was better than FIB-4 and positively correlated with the degree of liver fibrosis in histopathological examination of liver biopsy [28, 29].
We could not find any correlation between RPR and fibrosis degree, and there was no difference between the two studied groups as regards RPR. In agreement with our results, a recent cross-sectional study was carried out in Nigeria on 264 subjects, they studied different serum markers as predictors of fibrosis, and they reported that RPR showed no significant difference between studied groups [30].
Contrary to our results, Wang et al. [31] concluded that RDW was positively associated with the severity of CHB, and even it can independently predict the long-term prognosis of chronic hepatitis B patients with liver cirrhosis. And Tubung et al.’s [23] study showed that RPR had high sensitivity and specificity for predicting severe liver fibrosis in CHB patients. This controversy may be attributed to the different methods of assessing liver fibrosis, the different populations and the inclusion of patients suffering from a wide range of liver diseases in these studies rather than patients with chronic hepatitis B as included in our study.
Quite the opposite of our results, a systematic review with meta-analysis was performed by Cai et al. [32] to study the diagnostic accuracy of RPR for predicting the stages of liver fibrosis in patients with chronic liver disease, and they concluded that RPR presented good performance for the prediction of significant fibrosis, advanced fibrosis, and cirrhosis in patients with chronic liver diseases. Also, another meta-analysis was performed to study the association of red blood cell distribution width with the severity of hepatitis B virus-related liver diseases and concluded that RDW levels are elevated in HBV patients compared to healthy controls, and it can be suggested as a marker for differentiating CHB patients from healthy controls or cirrhotics [33-35]. The unbalance of geographical distribution, without valid data in European countries, may bias the results [36-38]. This difference from our results can be attributed to the different study populations as they included patients with different chronic liver diseases, and not only HBV as in the present study. In addition, the lack of prospective nature of this study and small patient numbers for some sites and etiologies might also increase bias [39-41].
Limitations of this study were the small sample size, and non of our patients had a liver biopsy, which is still the gold standard for assessing liver fibrosis, so further studies with a larger cohort are needed to confirm our results.
CONCLUSION
The accuracy of RDW to platelet ratio (RPR) for the detection of fibrosis in CHB patients is questionable. FIB-4 is correlated with LSM in patients with significant fibrosis (F2 or more). Either RPR, APRI, or FIB4 can replace fibroscan for grading of fibrosis in CHB patients for evaluation to start therapy.
Recommendation: The role of RDW/platelet ratio in detecting the degree of hepatic fibrosis in asymptomatic CHB patients is questionable and needs more evaluation.
LIST OF ABBREVIATIONS
| RPR | = RDW to Platelet Ratio |
| LSM | = Liver Stiffness Measurement |
| HBV | = Hepatitis B Virus |
ETHICS APPROVAL AND CONSENT TO PARTICIPATE
The study was approved by Tanta University Ethical Committee (approval code 32996/03/19).
HUMAN AND ANIMAL RIGHTS
No animals were used in this research. All procedures performed in studies involving human participants were in accordance with the ethical standards of the institutional and/or research committee and with the 1975 Declaration of Helsinki, as revised in 2013.
CONSENT FOR PUBLICATIONS
Informed consent was obtained from all participants.
STANDARDS OF REPORTING
STROBE guidelines were followed.
AVAILABILITY OF DATA AND MATERIAL
The data and supportive information are available within the article.
FUNDING
None.
CONFLICT OF INTEREST
Dr. Sherief Abd-Elsalam is the Associate Editorial Board Member of the journal The Open Biomarkers Journal.
ACKNOWLEDGEMENTS
Declared none.