All published articles of this journal are available on ScienceDirect.

Association of Salivary α2-Macroglobulin Levels with Glycaemic Status and Diabetic Retinopathy in Patients with Type 2 Diabetes Mellitus
 iD
Revinselvan Prakash2
Sivaramakrishnan Ramachandiran3
iD
Suresh Lakki Reddy4
Authors Info & Affiliations
Abstract
Introduction
Identification of non-invasive biomarkers reflecting glycaemic status and microvascular risk remains a priority in type 2 Diabetes Mellitus (T2DM). α2-Macroglobulin (α2MG), a high-molecular-weight acute-phase glycoprotein involved in inflammatory regulation, increases in hyperglycaemic states and may be detectable in saliva. This study evaluated the association of salivary α2MG with glycaemic control and Diabetic Retinopathy (DR).
Methods
In this cross-sectional study (January–October 2025), 130 adults were categorised as healthy controls (n=26), controlled T2DM (n=52), and uncontrolled T2DM (n=52). Unstimulated saliva was collected and α2MG quantified by enzyme-linked immunosorbent assay. Glycaemic indices, lipid parameters, insulin levels, Homeostatic Model Assessment of Insulin Resistance (HOMA-IR), and DR status were assessed. Correlation, multivariable regression, and Receiver Operating Characteristic (ROC) analyses were performed.
Results
Salivary α2MG concentrations were significantly higher in uncontrolled T2DM than in controlled T2DM and controls (P < 0.001). α2MG correlated positively with fasting glucose, postprandial glucose, glycated haemoglobin (HbA1c), triglycerides, insulin levels, and HOMA-IR. Participants with DR had significantly higher α2MG concentrations than those without retinopathy (P < 0.001). ROC analysis showed modest discrimination for identifying uncontrolled T2DM, with an optimal cut-off of 764 ng/mL (sensitivity 76.15%; specificity 70%).
Discussion
These findings suggest salivary α2MG reflects both metabolic dysregulation and microvascular injury, supporting its potential relevance as a non-invasive adjunct biomarker in diabetes monitoring, complication risk assessment, and microvascular risk stratification in T2DM.
Conclusion
Salivary α2MG was associated with glycaemic dysregulation and DR in T2DM, supporting its potential as a non-invasive adjunct biomarker. Its ease of collection may facilitate metabolic assessment, particularly in resource-limited settings, pending longitudinal validation.
1. INTRODUCTION
Type 2 Diabetes Mellitus (T2DM) is a global health challenge characterised by chronic hyperglycaemia and progressive vascular complications affecting the retina, kidneys, and peripheral nerves. According to the International Diabetes Federation Diabetes Atlas, 11th edition (2025), an estimated 589 million adults aged 20–79 years worldwide are living with diabetes, representing nearly one in nine adults. More than 90% of these cases are T2DM, and approximately 252 million individuals remain undiagnosed, highlighting the substantial global burden of the disease [1, 2]. Glycaemic control is commonly assessed using fasting plasma glucose, postprandial glucose, and glycated haemoglobin (HbA1c). Although HbA1c is the standard indicator of long-term glycaemic exposure, its accuracy may be affected by conditions such as anaemia, haemoglobinopathies, altered erythrocyte turnover, pregnancy, and systemic disorders [3]. These limitations highlight the need for complementary biomarkers that reliably reflect metabolic burden.
Saliva has emerged as a promising non-invasive diagnostic medium containing proteins, enzymes, immunoglobulins, hormones, and inflammatory mediators that reflect systemic physiological and pathological processes [4]. Saliva collection is simple, inexpensive, and well tolerated, allowing repeated measurements [5]. Several salivary biomarkers have shown associations with glycaemic status and diabetic complications [6].
α2-Macroglobulin (α2MG) is a high-molecular-weight acute-phase glycoprotein synthesised in the liver that functions as a broad-spectrum proteinase inhibitor and regulator of inflammatory processes [7]. Elevated circulating α2MG in T2DM may reflect chronic inflammation and vascular injury [8]. Hyperglycaemia-induced microvascular changes may permit the diffusion of high-molecular-weight proteins, such as α2MG, into saliva [9], and studies have reported correlations with glycaemic indices, including HbA1c [10].
However, evidence regarding its diagnostic performance and association with Diabetic Retinopathy (DR) remains limited. Therefore, this study evaluated the relationship between salivary α2MG and glycaemic status in T2DM and investigated its association with DR using Receiver Operating Characteristic (ROC) analysis.
2. Materials and Methods
2.1. Study Design and Ethical Approval
This analytical cross-sectional study was conducted over ten months from January 2025 to October 2025. The study followed methodological standards recommended by the STROBE guidelines [11]. Ethical approval was obtained from the Institutional Ethics Committee, and written informed consent was obtained from all participants prior to enrolment; study procedures adhered to the principles of the Declaration of Helsinki [12].
2.2. Participants and Grouping
A total of 165 individuals were screened for eligibility. Of these, three did not meet the inclusion criteria, 17 met one or more exclusion criteria, 10 declined to participate, three provided inadequate saliva samples for analysis, and two had incomplete clinical or laboratory data. Consequently, 130 participants were enrolled in the study, comprising 52 participants with uncontrolled T2DM, 52 with controlled T2DM, and 26 healthy controls. Diabetes was defined and stratified according to the 2024 American Diabetes Association Standards of Medical Care [13]. Healthy controls had no history of diabetes and an HbA1c < 5.7%. Controlled diabetes was defined as HbA1c ≤ 7%, and uncontrolled diabetes as HbA1c > 7%.
Inclusion criteria comprised adults aged ≥18 years who provided informed consent and met predefined study-group criteria, including non-diabetic controls or individuals with established type 2 diabetes classified according to HbA1c status. Exclusion criteria included acute infections, chronic inflammatory or autoimmune diseases, hepatic or renal disease (including clinically diagnosed diabetic nephropathy based on medical history and serum creatinine), pregnancy, smoking, alcohol consumption, salivary gland disorders, xerostomia-inducing medications, recent dental procedures, and active oral infectious conditions. Participants with healthy gingiva or clinically stable periodontal conditions without evidence of acute oral infection were eligible for inclusion. Periodontal status was subsequently assessed using a CPITN probe and recorded for all dentulous participants in accordance with established recommendations for salivary biomarker research [14]. Healthy controls were age-matched individuals without a history of diabetes or other systemic diseases. Eligibility was confirmed through medical history, clinical assessment, HbA1c measurement, and application of the same exclusion criteria used for the diabetic groups, including the absence of acute infections, chronic inflammatory or autoimmune diseases, hepatic or renal disease, pregnancy, smoking, alcohol consumption, salivary gland disorders, xerostomia-inducing medications, recent dental procedures, or other conditions known to influence salivary biomarkers.
Previous studies have reported moderate-to-strong correlations between salivary α2-macroglobulin and glycaemic markers, supporting the assumption of a moderate effect size for sample size estimation. Owing to heterogeneity in study design and reporting, including the absence of consistently reported means and standard deviations, a conventional effect size could not be calculated directly from the published literature. Therefore, the sample size estimation was based on an assumed moderate effect size derived from the available evidence. Using a two-sided significance level of 5% and a statistical power of 80%, the required sample size was calculated using IBM SPSS Statistics. Accordingly, a total of 130 participants were included in the study.
2.3. Clinical and Biochemical Measurements
Demographic and clinical information, including age, sex, Body Mass Index (BMI), duration of diabetes, medication use, and comorbidities, were recorded. After an overnight fast of at least ten hours, venous blood samples were collected to measure fasting and postprandial glucose, HbA1c, total cholesterol, triglycerides, High-Density Lipoprotein Cholesterol (HDL-C), Low-Density Lipoprotein Cholesterol (LDL-C), fasting insulin, and serum creatinine. Glucose, lipid parameters, hs-CRP, and fasting insulin were measured using an automated clinical chemistry analyser (cobas c 111; Roche Diagnostics GmbH, Mannheim, Germany). HbA1c was measured using the Merilyzer GluQuant A1c™ HPLC analyser (Meril Diagnostics Pvt. Ltd., Vapi, Gujarat, India), which is based on ion-exchange chromatography. Serum creatinine was measured using the modified Jaffe kinetic method on an automated biochemical analyser (Beacon Diagnostics Pvt. Ltd., Navsari, Gujarat, India).
Indices of insulin resistance and β-cell function were calculated using the Homeostatic Model Assessment (HOMA) described by Wallace et al. [15]. Homeostatic Model Assessment of Insulin Resistance (HOMA-IR) and Homeostatic Model Assessment of β-cell function (HOMA-β) (%) were calculated using the HOMA2 calculator (Version 2.2.3; Diabetes Trials Unit, University of Oxford), which remains a reliable surrogate method for assessing insulin dynamics in metabolic research.
2.4. Saliva Collection and Processing
Unstimulated whole saliva was collected between 8:00 AM and 10:00 AM to minimise diurnal variation. Participants refrained from food, beverages, caffeine, smoking, and oral hygiene procedures for at least 90 minutes before sampling. While seated upright, saliva was allowed to accumulate passively and was collected by drooling into sterile polypropylene tubes, following the protocol of Navazesh and Kumar [16].
Samples were immediately placed on ice, centrifuged at 3000 rpm for 10 minutes, aliquoted to prevent repeated freeze–thaw cycles, and stored at –80°C until analysis. Sample handling followed current recommendations for salivary proteomic research [14].
2.5. Estimation of Salivary α2MG
Salivary α2MG concentrations were measured using a Quantitative Enzyme-Linked Immunosorbent Assay (ELISA) kit (EM1115-1; AssayMax™ Human Alpha-2-Macroglobulin ELISA Kit, Cat. No. EM1115-1, Assaypro LLC, St. Charles, MO, USA) according to the manufacturer's instructions [17]. Standards and samples were analysed in duplicate. Optical density was measured at 450 nm, and concentrations were calculated using a standard curve ranging from 0 to 2000 ng/mL. ELISA-based measurement of α2MG is a validated method with high analytical sensitivity in biomarker studies [7].
2.6. Assessment of Diabetic Retinopathy
Participants underwent ophthalmic evaluation by a qualified ophthalmologist. Slit-lamp biomicroscopy and indirect ophthalmoscopy were performed, and DR was classified according to the International Clinical Diabetic Retinopathy Severity Scale [18].
2.7. Statistical Analysis
Statistical analyses were performed using IBM SPSS Statistics Version 26.0. Normality was assessed using the Shapiro–Wilk test. Continuous variables were expressed as mean ± standard deviation, and categorical variables as proportions. Group comparisons were conducted using one-way Analysis of Variance (ANOVA) with Tukey post hoc testing.
Associations between salivary α2MG and metabolic variables were evaluated using Spearman’s rank correlation. Multivariate linear regression identified independent factors associated with salivary α2MG levels. Diagnostic performance for distinguishing uncontrolled from controlled diabetes was assessed using ROC curve analysis, with Area Under the Curve (AUC), optimal cut-off value, sensitivity, specificity, positive predictive value, and negative predictive value calculated.
Univariate logistic regression evaluated associations between clinical and biochemical variables and DR. Significant variables were entered into a multivariate logistic regression model to determine the independent association of salivary α2MG with DR after adjustment for potential confounders. A two-sided P-value < 0.05 was considered statistically significant.
3. RESULTS
A total of 130 participants were enrolled: 52 with uncontrolled diabetes, 52 with controlled diabetes, and 26 non-diabetic controls. Of the 130 participants, 62 (47.7%) were women, and 68 (52.3%) were men, including 24 women in the uncontrolled diabetes group, 25 in the controlled diabetes group, and 13 among controls. Groups were comparable in age, sex distribution, BMI, systemic comorbidities, family history of diabetes, dentition status, and periodontal parameters. Significant differences were observed for ischaemic heart disease, which was more frequent in the controlled diabetes group (P = 0.008), and insulin use, which was higher among those with uncontrolled diabetes (P = 0.023). All other baseline characteristics showed no statistically significant differences (Table 1).
| Variable | Uncontrolled DM (n=52) | Controlled DM (n=52) | Controls (n=26) | P-value |
|---|---|---|---|---|
| Age (years), mean ± SD | 58.46 ± 10.11 | 60.98 ± 10.26 | 60.27 ± 10.07 | 0.439 |
| Male (%) | 53.8 | 51.9 | 50.0 | 0.947 |
| Duration of diabetes >10 yrs (%) | 40.4 | 25.0 | 0.114 | |
| Hypertension (%) | 36.5 | 42.3 | 15.4 | 0.058 |
| Ischaemic heart disease (%) | 1.9 | 15.4 | 0 | 0.008 |
| Family history present (%) | 71.2 | 67.3 | 53.8 | 0.652 |
| Insulin use (%) | 23.1 | 5.8 | 0.023 | |
| Dentulous (%) | 32.7 | 40.4 | 46.2 | 0.797 |
| Periodontitis (CAL ≥3 mm) (% dentulous) | 48.5 | 46.9 | 48.0 | 0.803 |
| BMI (kg/m2), mean ± SD | 26.57 ± 5.03 | 25.83 ± 3.27 | 24.70 ± 4.68 | 0.200 |
Notes: Duration of diabetes and insulin use do not apply to the control group. Periodontitis (%) calculated only among dentulous participants. P-values were obtained using ANOVA for continuous variables and the χ2 test for categorical variables.
Biochemical profiling demonstrated clear metabolic stratification across groups. Those with uncontrolled diabetes had significantly higher fasting glucose and HbA1c (both P < 0.001) and markedly reduced HOMA-β function (P < 0.001). This group also exhibited a more atherogenic lipid profile, with higher total cholesterol (P = 0.010) and triglycerides (P < 0.001) and lower HDL-C (P = 0.021). Unstimulated salivary flow rate was lowest among participants with uncontrolled diabetes (P < 0.001). HOMA-IR, high-sensitivity C-Reactive Protein (hs-CRP), and LDL-C did not differ significantly between groups (Table 2).
| Parameter | Uncontrolled DM | Controlled DM | Controls | P-value |
|---|---|---|---|---|
| Fasting glucose (mg/dL) | 197.80 ± 82.67 | 123.19 ± 33.65 | 99.33 ± 10.76 | <0.001 |
| HbA1c (%) | 10.12 ± 1.85 | 6.85 ± 0.56 | 5.76 ± 0.30 | <0.001 |
| HOMA-β | 50.91 ± 34.87 | 97.84 ± 47.08 | 131.56 ± 42.12 | <0.001 |
| HOMA-IR | 3.52 ± 4.83 | 2.29 ± 1.25 | 2.25 ± 1.25 | 0.100 |
| hs-CRP (mg/L) | 5.69 ± 6.21 | 4.30 ± 3.65 | 3.60 ± 2.50 | 0.131 |
| Total cholesterol (mg/dL) | 231.44 ± 86.14 | 182.11 ± 76.58 | 178.57 ± 56.94 | 0.010 |
| LDL-C (mg/dL) | 110.41 ± 41.99 | 103.44 ± 38.37 | 123.53 ± 33.44 | 0.104 |
| HDL-C (mg/dL) | 38.02 ± 6.60 | 42.78 ± 10.95 | 43.04 ± 11.59 | 0.021 |
| Triglycerides (mg/dL) | 183.01 ± 94.93 | 135.89 ± 67.24 | 111.99 ± 45.99 | <0.001 |
| USFR (mL/min) | 0.29 ± 0.08 | 0.28 ± 0.08 | 0.39 ± 0.07 | <0.001 |
Note:P-values obtained using ANOVA.
Salivary α2MG concentrations differed significantly between groups (Fig. 1), with higher levels in participants with uncontrolled diabetes (P < 0.001). Salivary α2-macroglobulin concentrations did not differ significantly between dentulous and edentulous participants, suggesting that dentition status was unlikely to have materially influenced the observed findings.
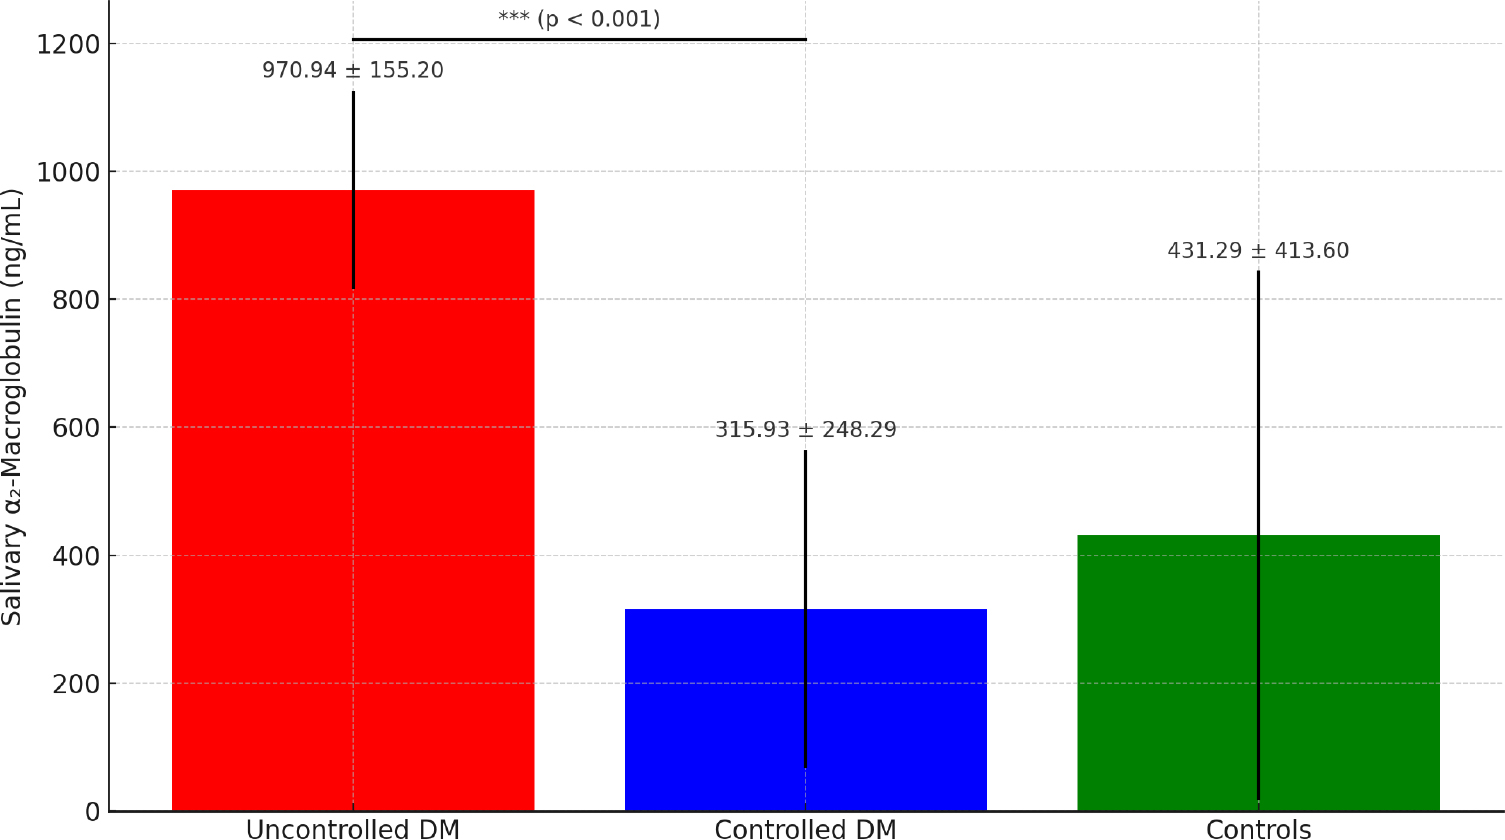
Mean salivary α2-macroglobulin (α2MG) concentrations among participants with uncontrolled diabetes, controlled diabetes, and healthy controls. Bars represent mean ± SD. Differences between groups were analysed using ANOVA (One-way ANOVA with Tukey post hoc test; ***P < 0.001).
Abbreviations: DM – Diabetes Mellitus; SD – Standard Deviation.
Among the participants with diabetes, salivary α2MG levels were significantly higher in those with DR (978.94 ± 196.38 ng/mL) than in those without DR (406.94 ± 97.02 ng/mL; P < 0.001), representing nearly a two-fold increase in mean concentrations.
Correlation analysis (Table 3) showed strong positive associations between salivary α2MG and glycaemic burden markers, including HbA1c (r = 0.658, P < 0.001) and fasting glucose (r = 0.585, P < 0.001). α2MG also correlated positively with triglycerides, total cholesterol, hs-CRP, and HOMA-IR, and negatively with HDL-C and HOMA-β. Modest inverse correlations were observed with systolic and diastolic blood pressure. No significant associations were found with age, BMI, or LDL-C.
| Variable | r | P-value |
|---|---|---|
| HbA1c (%) | 0.658 | <0.001 |
| Fasting glucose | 0.585 | <0.001 |
| HOMA-β | −0.573 | <0.001 |
| Triglycerides | 0.258 | 0.003 |
| hs-CRP | 0.286 | 0.001 |
| HOMA-IR | 0.202 | 0.021 |
| HDL-C | −0.219 | 0.012 |
| Total cholesterol | 0.180 | 0.040 |
| SBP / DBP | −0.299 | 0.031 |
| DBP | −0.368 | 0.007 |
Note: Correlations calculated using Spearman’s correlation coefficient.
Controlled and uncontrolled diabetes groups did not differ significantly in diabetes duration; duration was included as a covariate in logistic regression evaluating associations with DR.
In univariate logistic regression, salivary α2MG was the only variable significantly associated with DR (odds ratio [OR] = 1.010; 95% Confidence Interval [CI]: 1.006–1.014; P < 0.001), corresponding to approximately a 2.7-fold higher odds of retinopathy per 100 ng/mL increase. The association remained significant after adjustment for age, sex, treatment modality, diabetes duration, and glycaemic control (adjusted OR = 1.008; 95% CI: 1.002–1.014; P < 0.05), indicating an independent association between salivary α2MG and DR (Table 4).
| Factors | Univariate analysis | Multivariate analysis | ||||||
|---|---|---|---|---|---|---|---|---|
|
Odds Ratio |
95% CI | P- value |
Odds Ratio |
95% CI | P- value | |||
| Lower | Upper | Lower | Upper | |||||
| α2MG | 1.010 | 1.006 | 1.014 | 1.008 | 1.008 | 1.002 | 1.014 | <0.05 |
| Age | 0.984 | 0.947 | 1.023 | 1.048 | 1.048 | 0.966 | 1.137 | 0.260 |
| Gender Male Female (R) |
0.758 | 0.347 | 1.658 | 3.133 | 3.133 | 0.711 | 13.810 | 0.131 |
| Therapy Monotherapy (R) Single combination Multi-drug |
6.095 0.980 |
0.636 0.436 |
58.375 2.199 |
17.563 0.542 |
17.563 0.542 |
0.135 0.123 |
2288.979 2.379 |
0.249 0.417 |
| Duration of diabetes in years | 1.018 | 0.971 | 1.068 | 0.983 | 0.983 | 0.904 | 1.070 | 0.694 |
| Study Group Uncontrolled diabetes Controlled diabetes |
36.182 | 19.538 | 44.413 | 2.795 | 2.795 | 0.229 | 34.062 | 0.420 |
Salivary α2MG showed moderate discriminatory ability for differentiating uncontrolled from controlled diabetes (AUC = 0.692). The optimal cut-off by Youden index was 764 ng/mL, corresponding to 76.15% sensitivity, 70.10% specificity, positive predictive value 71.8%, and negative predictive value 74.6% (Fig. 2).
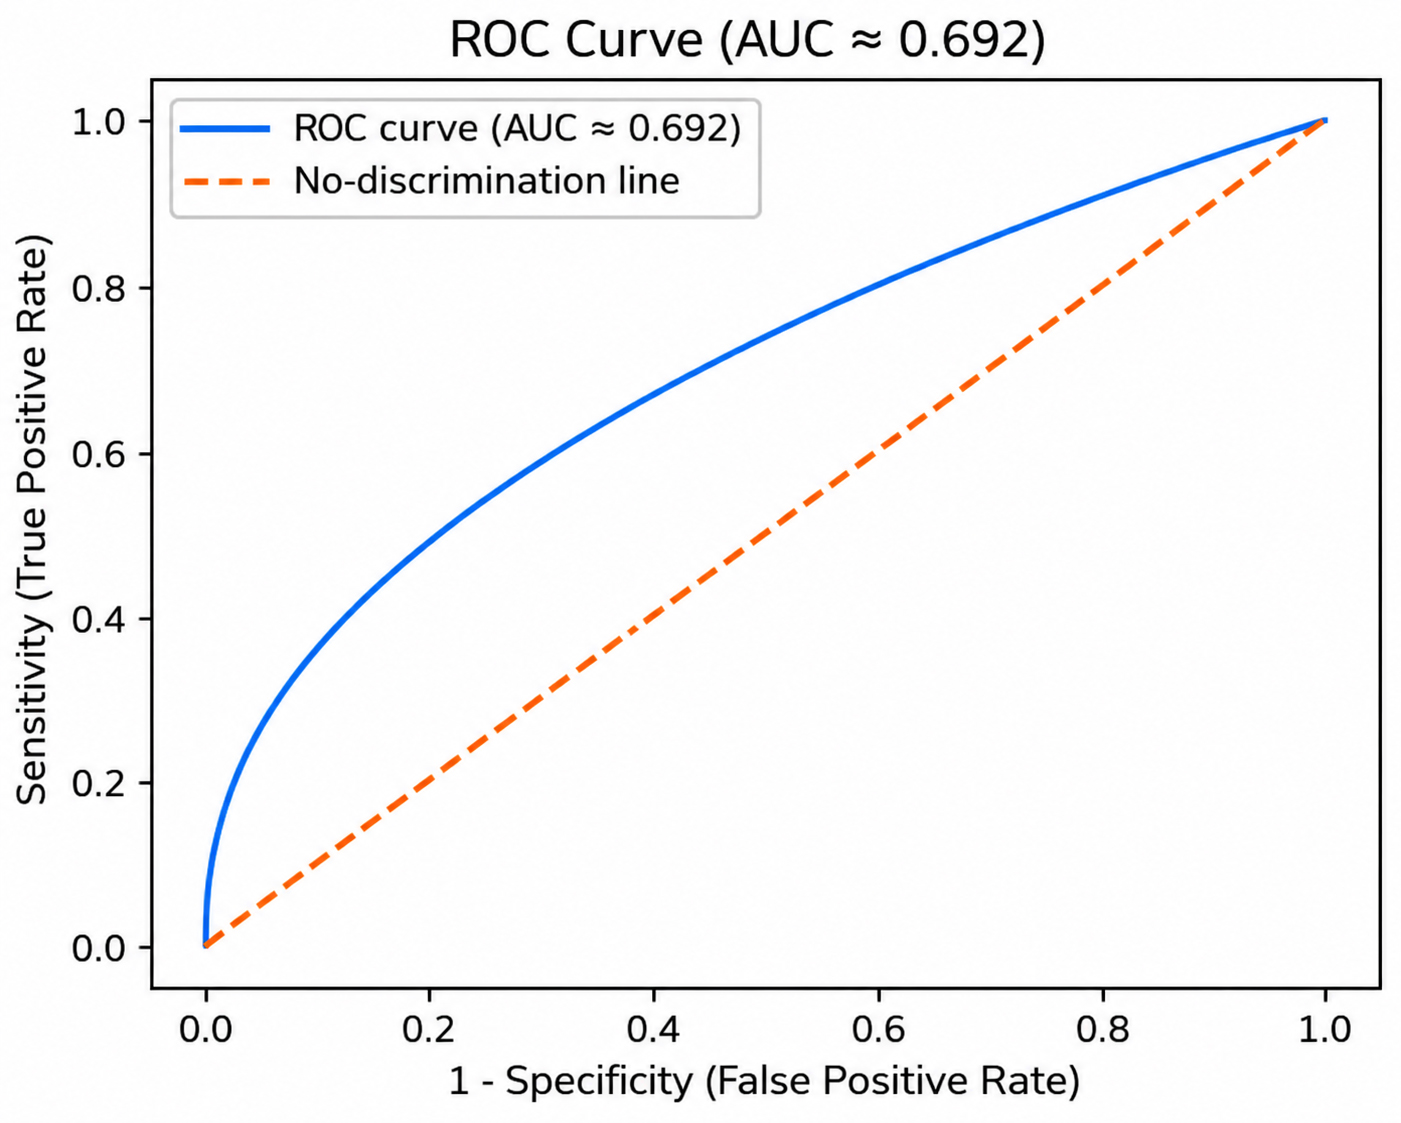
Receiver operating characteristic (ROC) curve showing the ability of salivary α2-macroglobulin (α2MG) to distinguish uncontrolled from controlled diabetes. The area under the curve (AUC) was 0.692 (P < 0.001). The diagonal line indicates no discrimination.
4. DISCUSSION
This study evaluated salivary α2MG as a non-invasive biomarker of glycaemic control and microvascular involvement in T2DM. Salivary α2MG levels were significantly higher in those with uncontrolled diabetes than in the other two groups, and showed moderate to strong correlations with HbA1c and fasting glucose across the cohort. The slightly higher mean α2MG observed among controls compared with the controlled diabetes group may reflect inter-individual biological variability, oral inflammatory conditions, or assay variability reported in salivary biomarker studies. Within-sample ROC analysis suggested moderate discriminatory performance for poor glycaemic control within the study cohort (AUC = 0.692), with an optimal cut-off of ≥764 ng/mL (76.15% sensitivity, 70% specificity). In multivariate analysis, α2MG was the only variable independently associated with DR, and its associations with higher HOMA-IR and lower HOMA-β further linked it to insulin resistance and β-cell dysfunction.
These findings are consistent with the inflammatory and oxidative mechanisms implicated in T2DM. Obesity-induced adipokine activation triggers interleukin-1β/ interleukin-18 pathways and a hepatic acute-phase response [3]. Positive acute-phase proteins such as hs-CRP, serum amyloid A, and α2MG can increase up to tenfold, and α2MG has been implicated in non-alcoholic fatty liver disease, impaired wound healing, cardiovascular disease, liver fibrosis, and Alzheimer’s disease in patients with diabetes [10]. Synthesised mainly in the liver, and partly in fibroblasts and macrophages, α2MG is usually restricted from glomerular filtration [8]. In diabetes, microvascular and basement membrane injury in salivary glands permits activated α2MG to enter saliva, thereby making it a measurable indicator of systemic inflammatory and metabolic stress [19].
4.1. Comparison with Prior Salivary α2MG Studies in T2DM
Early investigations first established salivary α2MG as a potential surrogate of glycaemic exposure, with Aitken et al. reporting clear correlations with HbA1c and suggesting an 840 ng/mL diagnostic threshold [7]. Subsequent work progressively strengthened this association: Chung et al. demonstrated that α2MG not only correlated with fasting glucose and HbA1c but also mirrored short-term glycaemic shifts over a three-month period [20], while Feng et al. confirmed higher concentrations in uncontrolled diabetes, although their weaker correlations were likely influenced by early-morning sampling, highlighting the importance of methodological standardisation [21].
As analytic techniques improved and sample sizes increased, more recent studies began to delineate the biomarker gradient across glycaemic states with greater precision. Rastogi et al. reaffirmed strong HbA1c correlations [22], whereas more recent evidence from Goel et al. further demonstrated a stepwise rise in salivary α2MG across glycaemic states, with strong correlation to HbA1c and promising diagnostic accuracy for identifying inadequate glycaemic control [23]. Sarkar et al. reached similar conclusions, reporting strong correlations and an AUC of 0.915 despite lower absolute concentrations attributable to inter-assay variability [24]. Likewise, Nsr-Allah et al. refined diagnostic thresholds by identifying a 645 ng/mL cut-off for predicting HbA1c ≥7% [25], while El-Assal et al. and El-Alfy et al. demonstrated comparable three-tier separation of glycaemic states using a different ELISA platform [26, 27]. Caixeta et al.’s meta-analysis demonstrated a robust pooled correlation between salivary α2MG and HbA1c [10], and Le et al.’s work emphasised that α2MG reliably complements multi-marker panels integrating inflammatory and metabolic indicators [28]. Such integrated analyses support the individual observations.
Our diagnostic performance (AUC 0.692; cut-off ≥764 ng/mL) falls within the range of published estimates and aligns well with patterns reported in earlier studies [7, 23, 25-27]. Differences in absolute thresholds appear to reflect variation in population characteristics, sampling protocols, and assay methodologies. Within-sample ROC analysis demonstrated modest discriminatory performance of salivary α2MG for poor glycaemic control; however, these estimates should be interpreted as exploratory due to the modest sample size and lack of external validation.
4.2. Insulin Resistance and β-cell Function
To the best of our knowledge, this is the first study to relate salivary α2MG to both HOMA-IR and HOMA-β. Its positive association with HOMA-IR and inverse association with HOMA-β indicate that α2MG reflects broader metabolic dysfunction, not just hyperglycaemia. These observations align with the established role of adipokines, including tumour necrosis factor-α, interleukin-6, interleukin-18, leptin, and resistin, in impairing insulin signalling and promoting β-cell stress [3], implying that α2MG up-regulation may integrate both inflammatory and metabolic pathways. Larger longitudinal studies are needed to validate this mechanistic link.
4.3. Salivary α2MG and DR
DR represents a key microvascular marker of chronic glycaemic injury, and its greater prevalence among those with uncontrolled diabetes in our cohort is consistent with established epidemiology [2]. In this context, the marked elevation of salivary α2MG in individuals with DR and its persistence as an independent association after multivariable adjustment provides clinically meaningful support for its microvascular relevance. Given that α2MG is a high–molecular-weight protein whose circulating levels may be influenced by renal dysfunction, individuals with clinically diagnosed renal disease, including diabetic nephropathy, were excluded to minimise renal-related confounding.
Previous evidence in this domain has been limited, with most studies focusing on serum or type 1 diabetes: Calixto et al. showed that salivary α2MG reflects innate immune activation in T2DM with complications [19], and Chee et al. identified α2MG among 119 salivary proteins differentially expressed across DR stages [29]. The findings extend this body of work by demonstrating a clear and independent association between salivary α2MG and DR in type 2 diabetes, suggesting that the marker may capture inflammatory microvascular stress beyond glycaemic burden alone.
4.4. Associations with Cand Inflammatory Markers
In the uncontrolled diabetes group, salivary α2MG correlated negatively with systolic and diastolic blood pressures, differing from Chung et al.’s findings [20]. The reason for this discrepancy remains unclear and may reflect differences in participant characteristics or study methodology.
Patients with uncontrolled diabetes had higher triglycerides and lower HDL-C, and salivary α2MG correlated positively with total cholesterol and triglycerides and negatively with HDL-C. This observation may reflect shared inflammatory pathways.
Hs-CRP did not differ significantly between groups, likely due to inflammatory comorbidities in some controls. The absence of a significant difference in hs-CRP between groups may reflect the influence of comorbid inflammatory conditions in some participants or the known variability of hs-CRP as a systemic inflammatory marker. This finding supports salivary α2MG as a more diabetes-specific inflammatory marker rather than a broad systemic signal.
4.5. Oral Environment and Methodological Considerations
Diabetes alters salivary composition and flow [28]. Both diabetic groups in our study exhibited reduced salivary flow, consistent with earlier reports. Mid-morning unstimulated samples were used to minimise the reported diurnal variation. Sandwich ELISA was chosen due to superior sensitivity over older precipitation assays [30].
Although gingivitis and periodontitis were common among participants with diabetes, no significant association was observed between salivary α2-macroglobulin levels and periodontal status in the study cohort. Together with the absence of significant differences in periodontal status across the study groups, these findings suggest that the observed associations between salivary α2-macroglobulin and glycaemic status or diabetic retinopathy are unlikely to be explained solely by periodontal inflammation. Nevertheless, residual confounding cannot be completely excluded.
4.6. Rationale for Selecting α2-Macroglobulin over other Salivary Biomarkers
Several salivary proteins have been investigated as non-invasive biomarkers in diabetes, including albumin, immunoglobulins, amylase, cytokines, and salivary HbA1c. However, many of these markers primarily reflect passive diffusion, transient inflammatory changes, or oral health status rather than systemic metabolic injury [24]. Salivary albumin is particularly sensitive to gingival inflammation and mucosal microbleeding, while salivary HbA1c reflects erythrocyte glycation and exists at very low concentrations in saliva, limiting its biological and analytical robustness. Conversely, α2MG represents an acute-phase protein integrally involved in inflammatory regulation and protease inhibition, and its salivary elevation plausibly reflects diabetes-related systemic inflammation and microvascular barrier dysfunction, mechanisms that are central to the pathogenesis of DR [10].
4.7. Clinical Implications and Future Directions
Salivary α2MG may represent a promising, non-invasive biomarker integrating glycaemic exposure, insulin resistance, β-cell dysfunction, and microvascular injury. Saliva-based assessment may be particularly valuable in resource-limited settings. Its moderately strong correlations with glycaemic markers, within-sample ROC performance, and independent association with retinopathy suggest that α2MG may support non-invasive assessment of microvascular involvement in patients with T2DM.
The observed AUC of 0.692 indicates only modest discriminatory performance, suggesting that salivary α2-macroglobulin should be interpreted as a complementary biomarker rather than a standalone diagnostic test. Although promising, salivary α2MG should currently be considered an exploratory biomarker pending validation in larger multicentre cohorts. Future studies should assess longitudinal changes in α2MG, validate predictive ability for DR progression, and evaluate integration into multi-marker algorithms. Standardised assays and cross-population validation are essential, as emphasised by the relevant systematic reviews [10, 28].
5. STRENGTHS AND LIMITATIONS
Limitations of this study include the cross-sectional design, single-centre sampling, and absence of serial α2MG measurements. The modest sample size may limit statistical power for subgroup analyses and affect regression stability. The wide confidence intervals and variable odds ratios observed for certain predictors in both the univariate and multivariate analyses likely reflect sparse outcome events within subgroups, which may have resulted in imprecise and unstable regression estimates. Comorbidities may have influenced inflammatory profiles, although these were considered. Because ROC analysis was performed without resampling or external validation, diagnostic performance estimates may be optimistic; the reported AUC values may overestimate real-world performance. The relatively small sample and single-centre design may limit generalisability, and larger multicentre studies are required to validate these findings. Regression estimates should therefore be interpreted cautiously, as sparse subgroup data may inflate ORs.
However, the strengths include detailed metabolic and ophthalmologic characterisation, standardised saliva collection with ELISA measurement, and comprehensive multivariable modelling. To our knowledge, this is among the few studies worldwide and the first from India to evaluate salivary α2MG in relation to both insulin resistance indices and DR. Building on the earlier works, our findings offer novel evidence supporting salivary α2MG as a clinically meaningful biomarker deserving broader validation.
CONCLUSION
In summary, this study demonstrates that salivary α2MG is significantly associated with glycaemic dysregulation and DR in individuals with T2DM. Elevated salivary α2MG levels correlated with key metabolic indicators, including HbA1c, fasting glucose, and insulin resistance indices, and remained independently associated with the presence of DR. These findings support the biological relevance of salivary α2MG as a non-invasive biomarker reflecting both metabolic burden and microvascular involvement. Although further validation in larger multicentre and longitudinal studies is required, salivary α2MG may represent a promising adjunct tool for non-invasive metabolic assessment and complication risk stratification in T2DM.
AUTHORS’ CONTRIBUTIONS
The authors confirm their contribution to the paper as follows: S.M.: Conceptualisation, methodology, investigation, data curation, writing – original draft, project administration, supervision, funding, final manuscript approval; S.R.: Formal analysis, software, validation, writing – review & editing; R.P: Resources, clinical assessment, data collection, supervision; S.L.: Visualisation, statistical interpretation, writing – review & editing. All authors have read and approved the final manuscript. the authors confirm that the manuscript meets the criteria for authorship as stated by the journal and that the work presented represents honest and original research.
LIST OF ABBREVIATIONS
| HbA1c | = Glycated haemoglobin |
| HOMA-β | = Homeostatic model assessment of β-cell function |
| HOMA-IR | = Homeostatic model assessment of insulin resistance |
| HDL-C | = High-density lipoprotein cholesterol |
| LDL-C | = Low-density lipoprotein cholesterol |
| hs-CRP | = High-sensitivity C-reactive protein |
| USFR | = Unstimulated salivary flow rate |
| HbA1c | = Glycated haemoglobin |
| HOMA-β | = Homeostatic model assessment of β-cell function |
| HOMA-IR | = Homeostatic model assessment of insulin resistance |
| HDL-C | = High-density lipoprotein cholesterol |
| hs-CRP | = High-sensitivity C-reactive protein |
| SBP | = Systolic blood pressure |
| DBP | = Diastolic blood pressure |
| α2MG | = α2-macroglobulin |
| CI | = Confidence interval |
ETHICS APPROVAL AND CONSENT TO PARTICIPATE
Ethical approval was obtained from the Institutional Ethics Committee of Ragas Dental College and Hospital, Chennai (Approval No.: IEC/RDC/2024/58).
HUMAN AND ANIMAL RIGHTS
All procedures involving human participants were conducted in accordance with the ethical standards of the committee responsible for human experimentation (institutional and national), and with the Helsinki Declaration of 1975, as revised in 2013.
CONSENT FOR PUBLICATION
Written informed consent was obtained from all participants prior to inclusion in the study.
AVAILABILITY OF DATA AND MATERIAL
The data supporting the findings of this study are available from the corresponding author upon reasonable request. Due to privacy and ethical restrictions, participant-level clinical data cannot be publicly shared.
FUNDING
This study was self-funded by the first author, Dr. Sruti Murali. No external financial funding was received. Laboratory infrastructure and technical support were provided by Techmed Health Center and Diagnostic Pvt. Ltd.
ACKNOWLEDGEMENTS
The authors express their sincere gratitude to the staff and faculty of Ragas Dental College and Hospital, Chennai, whose support made this study possible. Special thanks are extended to the Techmed Health Center and Diagnostic Pvt. Ltd. for providing access to laboratory infrastructure. The authors acknowledge the guidance of academic mentors who offered invaluable methodological and scientific insight during the conduct of the study. Heartfelt appreciation is conveyed to all study participants for their time and cooperation. The authors also thank colleagues and friends for their constant encouragement throughout the writing and revision process.