All published articles of this journal are available on ScienceDirect.

Assessment of Prodromal Gastrointestinal Manifestations in Idiopathic Parkinson's Disease
Abstract
Introduction
Parkinson's disease (PD) is a neurodegenerative disorder characterized by both motor and non-motor symptoms, including gastrointestinal (GI) disturbances. Prodromal GI symptoms often precede motor symptoms, potentially serving as early indicators of the disease. This study aimed to assess the prodromal GI manifestations in idiopathic PD and explore their correlation with disease onset.
Methods
A retrospective cross-sectional study was conducted involving 41 idiopathic PD patients and 29 age- and sex-matched healthy controls. Clinical assessment was performed using the Movement Disorder Society-Unified Parkinson’s Disease Rating Scale (MDS-UPDRS). GI symptoms were evaluated using the Gastrointestinal Dysfunction Scale for Parkinson’s Disease (GIDS-PD), Gastrointestinal (GIT) Non-Motor Symptoms Scale (GIT-NMSS), and ROME IV criteria for irritable bowel syndrome (IBS). The relationships between GI symptoms and various disease characteristics were then examined through correlation analysis.
Results
PD patients exhibited significantly higher GI dysfunction compared to controls (p < 0.001), with constipation, drooling, and dysphagia being the most prevalent symptoms. The GIDS-PD total score was significantly correlated with disease duration, duration of GI manifestations, NMSS domain 6, and specific MDS- UPDRS items (constipation, drooling, and chewing/swallowing difficulties), with the most predicting variable being disease duration. Notably, GI symptoms often precede motor symptoms for several years.
Conclusion
Prodromal GI symptoms are common in idiopathic PD and correlate with disease progression. These findings suggest that early recognition of GI disturbances could facilitate earlier diagnosis and intervention, potentially improving disease management and patient outcomes.
1. INTRODUCTION
Parkinson’s disease (PD), the second most common neurodegenerative disorder, affects approximately 3-5% of the global population. Recent estimates indicate that over 10 million people worldwide are living with Parkinson's disease, with nearly 90,000 people diagnosed with PD each year in the United States, with an expected rise of 1.2 million by 2030 [1].
As a multifactorial disease, its etiology is attributed to a complex interplay of genetic and environmental factors [2]. Traditionally, PD has been characterized by hallmark motor symptoms, but non-motor symptoms (NMS) have also become increasingly recognized for their significant role in disease progression and patient quality of life [3].
Among the NMS, gastrointestinal (GI) disturbances are of particular interest due to their potential occurrence in the prodromal phase, often preceding the onset of motor dysfunction [4]. According to Braak’s hypothesis, idiopathic PD may be initiated by a pathogen entering the body via the nasal cavity and subsequently reaching the GIT. This process then leads to the early deposition of Lewy bodies (LBs) in the central and enteric nervous systems (ENS) [5]. Thus, early GI changes suggest a possible gut-brain axis involvement in PD, with prodromal GI symptoms serving as potential early indicators of the disease [6].
In particular, GI manifestations, such as dysphagia, delayed gastric emptying, and small intestinal bacterial overgrowth (SIBO), frequently precede motor symptoms of PD over several years. Constipation, for example, is closely linked to early ENS dysfunction and the presence of LB in the gut [7]. These prodromal GI symptoms affect patients' quality of life and also complicate the efficacy of oral antiparkinsonian therapies by interfering with medication absorption, leading to delayed or inconsistent drug effects and motor fluctuations [8].
Additionally, evidence supports a “top-down” progression of the disease, wherein GI symptoms occur early, even before neurological symptoms become apparent [9, 10]. This suggests that GI dysfunction may serve as a precursor or risk factor for PD onset. Furthermore, gastrointestinal comorbidities, including constipation, peptic ulcers, Helicobacter pylori infection, bloating, and nausea, have been observed in PD patients up to 8–10 years before the onset of motor symptoms [11, 12], further emphasizing the critical role of gastrointestinal health in the early stages of the disease.
This study aimed to assess the prodromal GI manifestations in idiopathic PD and investigate their correlation with the disease onset.
2. PATIENTS AND METHODS
2.1. Study Design and Patient Selection
This retrospective, cross-sectional study was conducted between October, 2023 and April, 2024 at the Neurology and Tropical Medicine Departments of Tanta University Hospitals. All participants were thoroughly informed about the study procedures. Ethical approval was obtained from the Tanta University Research Ethics Committee (REC) before commencing the study (No. 36264PR341/9/23).
Clinical records of 134 patients diagnosed with Parkinson's disease at neurology clinics were reviewed. Out of this sample, 23 patients were unreachable; 20 did not complete the interview; 43 declined to participate in the study; and 7 were excluded due to diagnoses of non-idiopathic Parkinson's disease (drug-induced Parkinsonism).
A total of 70 participants were included in the study. The study group consisted of 41 patients diagnosed with idiopathic PD. The diagnosis was based on the MDS diagnostic criteria, and participants completed the MDS-UPDRS [13]. Only patients who were willing and able to complete the required questionnaire were included. The control group included 29 age- and sex-matched healthy individuals with no known neurological or gastrointestinal disorders.
Participants diagnosed with idiopathic PD, confirmed via MDS diagnostic criteria, were included irrespective of their age, gender, age of onset of symptoms, and disease duration, provided they were able to complete the questionnaire. Patients with secondary or atypical Parkinsonism, those with severe cognitive impairments preventing questionnaire completion, or individuals unwilling to participate were excluded.
2.2. Clinical Assessment
All patients underwent detailed clinical evaluation, including personal histories, such as age, sex, age at disease onset, duration of illness, comorbidities, family history of the disease, and current antiparkinsonian treatment.
The clinical evaluation of idiopathic PD patients was conducted using the MDS-UPDRS, a validated tool that assesses both motor and non-motor symptoms across four sections. Part I (Non-Motor Experiences of Daily Living) examines NMS, such as cognitive function, mood, and GI symptoms, with input from both patients and caregivers. Part II (Motor Experiences of Daily Living) is self-reported and evaluates the impact of PD on daily activities, such as walking and speaking. Parts III and IV, which are clinician-administered, focus on motor function and complications, including motor fluctuations and dyskinesias [14]. Together, these sections provide a comprehensive view of disease severity and progression.
Each patient's score was calculated to correlate NMS, especially GI disturbances, with the progression of motor symptoms. Clinician reviews ensured completeness and clarity of the responses, particularly for patients who required assistance due to illiteracy and misunderstanding. This assessment allowed us to explore the relationship between early NMS, like gastrointestinal issues, and the overall progression of PD.
GI symptoms were evaluated using the GIDS-PD, composed of 12 items related to 3 domains: constipation (frequency of bowel movements, straining, hardness of stools, and incomplete evacuation), bowel irritability (abdominal pain, abnormal increase in stool passing, distension/bloating, and weight loss), and upper GIS (dysphagia, sialorrhea, heartburn, and nausea). Items 2–12 are answered as present or absent and further quantified according to frequency (occasionally, often, and frequently) and severity (mild, moderate, and severe), with scores ranging from 1 to 3, resulting in total scores ranging from 1 to 108. Higher scores reflect higher severity. Other supplementary items of the scale provide information about patients’ lifestyle related to gut health and include items 1a (measures taken to increase bowel movement frequency), 1b (duration of constipation), A (diet), B (fluid intake), C (caffeinated drinks intake), D (exercise), E (smoking), and F (medical diagnosis of GID). These supplementary items are not used for scoring [13]. The GIDS-PD allowed us to systematically document the frequency and severity of these symptoms in PD patients compared to healthy controls. The data collected from this questionnaire provided valuable insights into the prevalence of prodromal GI manifestations and their possible role in the early identification of PD.
For additional classification of bowel symptoms, the ROME IV criteria characterize IBS as recurring abdominal discomfort occurring at least once a week on average over the past three months, along with two or more of the following: (1) linked to bowel movements, (2) accompanied by altered stool frequency, or (3) associated with changes in stool appearance or consistency [15]. Furthermore, GIT-NMS were comprehensively evaluated, focusing on the type and onset of symptoms using the GIT-NMSS [16].
2.3. Statistical Analysis
Data was analyzed using IBM SPSS version 20.0 (Armonk, NY: IBM Corp). Continuous variables were expressed as means ± standard deviations, while categorical variables were reported as frequencies and percentages. Chi-square or Monte Carlo correction tests assessed categorical data, while the student T-test or Mann-Whitney test compared continuous variables based on normality. Spearman’s correlation coefficients were used to correlate two quantitative parameters in the same group. Multivariate linear regression was used to evaluate the effects of different variables on the GIDS-PD total score. Statistical significance was set at p < 0.05.
Steve Thompson equation (1) was employed for sample size calculations [17], which is as follows:
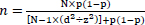 |
(1) |
3. RESULTS
3.1. Demographic and History Data
The study included 41 patients with idiopathic PD and 29 healthy controls. The mean age of the PD group was 53.7 ± 10.97 years, compared to 51.7 ± 13.03 years for the control group, with no significant difference between the groups (p = 0.473). Males represented 70.73% of the PD group and 55.17% of the control group, but the difference in sex distribution was not statistically significant (p = 0.181). However, there was a significant difference in the family history of neuropsychiatric illness and Parkinsonism, both of which were more prevalent in the PD group (p = 0.011) (Table 1).
The mean age of disease onset in PD patients was 47.18 ± 11.37 years, with a mean disease duration of 6.57 ± 3.98 years. PD patients experienced GI symptoms for an average duration of 8.73 ± 3.57 years. Moreover, 48.8% of the PD patients were classified as akinetic-rigid, 22.0% as tremor-dominant, and 29.3% had undetermined motor subtypes (Table 2).
|
Cases (N=41) |
Control (N=29) |
T-Test | P-value | ||||||
|---|---|---|---|---|---|---|---|---|---|
| Age (Years) | Range | 21 | - | 72 | 26 | - | 85 | 0.722 | 0.473 |
| Mean ±SD | 53.732 | ± | 10.970 | 51.655 | ± | 13.025 | |||
| N | % | N | % | X2 | P-value | ||||
| Sex | Male | 29 | 70.73 | 16 | 55.17 | 0.181 | 0.181 | ||
| Female | 12 | 29.27 | 13 | 44.83 | |||||
| Comorbidity | DM | 5 | 12.20 | 5 | 17.24 | 0.353 | 0.552 | ||
| HTN | 15 | 36.59 | 7 | 24.14 | 1.221 | 0.269 | |||
| HCV | 4 | 9.76 | 1 | 3.45 | 1.019 | 0.313 | |||
| IHD | 4 | 9.76 | 1 | 3.45 | 1.019 | 0.313 | |||
| Hyperlipidemia | 6 | 14.63 | 9 | 31.03 | 2.714 | 0.100 | |||
| Family history | Consanguinity | 11 | 26.83 | 3 | 10.34 | 2.885 | 0.089 | ||
| Neuropsychiatric illness | 8 | 19.51 | 0 | 0.00 | 6.389 | 0.011* | |||
| Parkinsonism | 8 | 19.51 | 0 | 0.00 | 6.389 | 0.011* | |||
|
Cases (N=41) |
||||
|---|---|---|---|---|
| Age of onset (years) | Range | 18.5 | - | 69 |
| Mean ±SD | 47.183 | ± | 11.370 | |
| Duration of illness (years) | Range | 1 | - | 22 |
| Mean ±SD | 6.573 | ± | 3.981 | |
|
Duration of GIT manifestations (years) |
Range | 3 | - | 20 |
| Mean ±SD | 8.732 | ± | 3.573 | |
| Chi-Square | N | % | ||
| Motor subtypes | Akinetic rigid | 20 | 48.8 | |
| Undetermined | 12 | 29.3 | ||
| Tremors dominant | 9 | 22.0 | ||
3.2. Comparing Clinical Characteristics and Gastrointestinal Dysfunction in PD Patients and Control Group
PD patients exhibited significantly more severe GI symptoms compared to the control group, as assessed by Domain 6 (GI Symptoms) of the Non-Motor Symptom Scale (NMSS). The mean score for GI symptoms in PD patients was 4.12 ± 1.94 compared to 0.48 ± 0.63 in controls (p < 0.001). The UPDRS also reflected these findings, with PD patients reporting significantly higher scores for constipation (mean = 1.68 ± 0.85 vs. 0.59 ± 0.87 in controls, p < 0.001), drooling, and chewing/swallowing difficulties (p < 0.001) (Table 3).
Using the GIDS-PD, PD patients reported more frequent and severe GI issues. Total GIDS-PD scores were significantly higher in the PD group (mean = 27.54 ± 12.47) compared to controls (mean = 12.31 ± 8.74, p < 0.001). The PD group exhibited particularly high scores in domains, such as bowel irritability, constipation, and upper GI symptoms, with each showing significant differences from the control group (p < 0.001). Constipation affected 39.02% of PD patients compared to 31.03% in the control group, although this difference was not statistically significant (p = 0.492). However, the duration of constipation was notably longer in PD patients (mean = 9.69 ± 5.21 years vs. 3.22 ± 1.64 years in controls, p = 0.002) (Table 3).
Other GI symptoms, such as gastroesophageal reflux disease (GERD), were also significantly more prevalent in PD patients (21.95%) compared to controls, where no cases were reported (p = 0.007). Additionally, 66.67% of PD patients were on medications for GI conditions like constipation or GERD (Table 3).
| Group | T-Test or Chi-Square | ||||||||
|---|---|---|---|---|---|---|---|---|---|
| Case | Control | T or X2 | P-value | ||||||
| Domain 6-GIT of NMSS | Range | 0 | - | 9 | 0 | - | 2 | 9.728 | <0.001* |
| Mean ±SD | 4.122 | ± | 1.939 | 0.483 | ± | 0.634 | |||
| UPDRS_Total_OFF | Range | 22 | - | 91 | 0 | - | 5 | 11.041 | <0.001* |
| Mean ±SD | 39.537 | ± | 18.881 | 0.690 | ± | 1.168 | |||
| UPDRS_Total_ON | Range | 8 | - | 56 | 0 | - | 5 | 12.578 | <0.001* |
| Mean ±SD | 33.171 | ± | 13.842 | 0.690 | ± | 1.168 | |||
| HY | Range | 1 | - | 2.5 | - | - | - | - | - |
| Mean ±SD | 1.549 | ± | 0.522 | - | ± | - | |||
| Constipation item of UPDRS | Range | 0 | - | 3 | 0 | - | 3 | 5.276 | <0.001* |
| Mean ±SD | 1.683 | ± | 0.850 | 0.586 | ± | 0.867 | |||
| Drooling item of UPDRS | Range | 0 | - | 4 | - | - | - | - | - |
| Mean ±SD | 1.171 | ± | 1.022 | - | ± | - | |||
| Chewing/swallowing items of UPDRS | Range | 0 | - | 3 | - | - | - | - | - |
| Mean ±SD | 1.220 | ± | 0.690 | - | ± | - | |||
| GIT.1 | Range | 2 | - | 6 | 0 | - | 4 | 3.080 | 0.003* |
| Mean ±SD | 2.878 | ± | 1.005 | 1.966 | ± | 1.476 | |||
| GIT.1A | Range | 1 | - | 4 | 0 | - | 3 | 8.055 | <0.001* |
| Mean ±SD | 2.439 | ± | 0.867 | 0.655 | ± | 0.974 | |||
| GIT.1B | Range | 1 | - | 3 | 0 | - | 2 | 9.863 | <0.001* |
| Mean ±SD | 2.024 | ± | 0.524 | 0.483 | ± | 0.785 | |||
| GIT.2 | Range | 1 | - | 9 | 0 | - | 6 | 4.321 | <0.001* |
| Mean ±SD | 3.439 | ± | 1.582 | 1.724 | ± | 1.709 | |||
| GIT.3 | Range | 1 | - | 6 | 0 | - | 6 | 4.448 | <0.001* |
| Mean ±SD | 3.366 | ± | 1.280 | 1.759 | ± | 1.746 | |||
| GIT.4 | Range | 1 | - | 9 | 0 | - | 6 | 4.098 | <0.001* |
| Mean ±SD | 3.390 | ± | 1.563 | 1.759 | ± | 1.746 | |||
|
Subscore Constipation |
Range | 5 | - | 30 | 1 | - | 26 | 3.166 | 0.002* |
| Mean ±SD | 13.610 | ± | 5.656 | 8.690 | ± | 7.344 | |||
| GIT.5 | Range | 1 | - | 6 | 0 | - | 4 | 8.505 | <0.001* |
| Mean ±SD | 3.000 | ± | 1.342 | 0.586 | ± | 0.867 | |||
| GIT.6 | Range | 1 | - | 6 | 0 | - | 4 | 4.151 | <0.001* |
| Mean ±SD | 2.146 | ± | 1.315 | 0.931 | ± | 1.033 | |||
| GIT.7 | Range | 1 | - | 6 | 0 | - | 4 | 4.965 | <0.001* |
| Mean ±SD | 2.780 | ± | 1.475 | 1.172 | ± | 1.104 | |||
| GIT.8 | Range | 0 | - | 2 | 0 | - | 1 | 0.706 | 0.483 |
| Mean ±SD | 0.171 | ± | 0.442 | 0.103 | ± | 0.310 | |||
|
Subscore Bowel irritability |
Range | 3 | - | 19 | 0 | - | 8 | 6.682 | <0.001* |
| Mean ±SD | 8.098 | ± | 3.897 | 2.655 | ± | 2.380 | |||
| GIT.9 | Range | 0 | - | 6 | 0 | - | 1 | 5.169 | <0.001* |
| Mean ±SD | 2.049 | ± | 1.843 | 0.241 | ± | 0.435 | |||
| GIT.10 | Range | 0 | - | 6 | - | - | - | - | - |
| Mean ±SD | 1.195 | ± | 1.364 | - | ± | - | |||
| GIT.11 | Range | 0 | - | 6 | 0 | - | 2 | 4.387 | <0.001* |
| Mean ±SD | 1.878 | ± | 1.503 | 0.552 | ± | 0.736 | |||
| GIT.12 | Range | 0 | - | 3 | 0 | - | 1 | 2.647 | 0.010* |
| Mean ±SD | 0.707 | ± | 0.873 | 0.241 | ± | 0.435 | |||
|
Subscore Upper GI |
Range | 0 | - | 16 | 0 | - | 3 | 5.908 | <0.001* |
| Mean ±SD | 5.829 | ± | 4.330 | 0.966 | ± | 1.085 | |||
| Total GIT | Range | 10 | - | 63 | 1 | - | 34 | 5.660 | <0.001* |
| Mean ±SD | 27.537 | ± | 12.468 | 12.310 | ± | 8.743 | |||
| GIT.A | Range | 3 | - | 6 | 1 | - | 6 | 4.058 | <0.001* |
| Mean ±SD | 5.780 | ± | 0.690 | 4.586 | ± | 1.701 | |||
| GIT.B | Range | 2 | - | 3 | 3 | - | 3 | -2.613 | 0.011* |
| Mean ±SD | 2.805 | ± | 0.401 | 3.000 | ± | 0.000 | |||
| GIT.C | Range | 1 | - | 3 | 1 | - | 3 | 1.189 | 0.239 |
| Mean ±SD | 2.341 | ± | 0.656 | 2.172 | ± | 0.468 | |||
| GIT.D | Range | 1 | - | 2 | 1 | - | 2 | -2.290 | 0.025* |
| Mean ±SD | 1.146 | ± | 0.358 | 1.379 | ± | 0.494 | |||
| GIT.E | Range | 1 | - | 3 | 1 | - | 3 | -0.577 | 0.566 |
| Mean ±SD | 1.537 | ± | 0.778 | 1.655 | ± | 0.936 | |||
| GIT.F.Constipation | No | 25 | 60.98 | 20 | 68.97 | 0.472 | 0.492 | ||
| Yes | 16 | 39.02 | 9 | 31.03 | |||||
| Current.med. GIT.F Constipation | No | 0 | 0.00 | 3 | 33.33 | 6.061 | 0.014* | ||
| Yes | 16 | 100.00 | 6 | 66.67 | |||||
| Diagnosis GIT.F Constipation (Years) | Range | 2 | - | 20 | 1 | - | 5 | 3.593 | 0.002* |
| Mean ±SD | 9.688 | ± | 5.212 | 3.222 | ± | 1.641 | |||
| GIT.F.IBD.IBD | No | 29 | 70.73 | 20 | 68.97 | 0.025 | 0.874 | ||
| Yes | 12 | 29.27 | 9 | 31.03 | |||||
| Current.med. GIT.F IBD | No | 4 | 33.33 | 2 | 22.22 | 0.311 | 0.577 | ||
| Yes | 8 | 66.67 | 7 | 77.78 | |||||
| Diagnosis GIT.F IBD (Years) | Range | 5 | - | 24 | 3 | - | 15 | 3.328 | 0.004* |
| Mean ±SD | 14.500 | ± | 5.486 | 7.333 | ± | 3.905 | |||
| GIT.F.GERD | No | 32 | 78.05 | 29 | 100.00 | 7.305 | 0.007* | ||
| Yes | 9 | 21.95 | 0 | 0.00 | |||||
| Current.med. GIT.F GERD | No | 1 | 11.11 | - | - | - | - | ||
| Yes | 8 | 88.89 | - | - | |||||
| Diagnosis GIT.F GERD (Years) | Range | 5 | - | 12 | - | - | - | - | - |
| Mean ±SD | 8.111 | ± | 2.759 | - | ± | - | |||
3.3. Correlations of Gastrointestinal Dysfunction among PD Patients
Table 4 highlights the correlations between GIT symptoms, motor characteristics, and demographic variables in PD patients. Key findings showed that the duration of illness had significant positive correlations with all GIT subscores and the total score, indicating worsening symptoms over time. NMSS Domain 6 also showed significant positive associations, particularly with upper GI symptoms (r = 0.693, p < 0.001). While the age of onset was significantly negatively correlated with upper GI issues (r = -0.325, p = 0.038), it was non-significantly negatively correlated with constipation, bowel irritability subscores, and total score, indicating that earlier onset was linked to many such problems. UPDRS items for constipation (r = 0.555, p < 0.001) and chewing/swallowing difficulties (r = 0.624, p < 0.001) showed strong positive correlations with GIT symptoms. However, UPDRS total scores (ON/OFF states) exhibited no significant associations, suggesting that motor severity did not directly influence GIT dysfunction.
No significant correlation was found between motor subtypes (akinetic-rigid, undetermined, and tremor-dominant) and GIT symptoms in PD patients (Table 5).
| Correlations | ||||||||
|---|---|---|---|---|---|---|---|---|
| Subscore of constipation | Subscore of bowel irritability | Subscore of Upper GI | Total GIT score | |||||
| R | P-value | R | P-value | R | P-value | r | P-value | |
| Age | 0.171 | 0.285 | 0.206 | 0.197 | -0.119 | 0.459 | 0.101 | 0.531 |
| Age of onset of illness | -0.054 | 0.735 | 0.013 | 0.934 | -0.325 | 0.038* | -0.133 | 0.406 |
| Duration of illness | 0.625 | <0.001* | 0.522 | <0.001* | 0.591 | <0.001* | 0.652 | <0.001* |
| Duration of GIT manifestations | 0.499 | 0.001* | 0.427 | 0.005* | 0.504 | 0.001* | 0.535 | <0.001* |
| Domain 6-GIT of NMSS | 0.485 | 0.001* | 0.528 | <0.001* | 0.693 | <0.001* | 0.626 | <0.001* |
| UPDRS_Total_OFF | -0.036 | 0.822 | -0.008 | 0.961 | 0.039 | 0.810 | -0.005 | 0.973 |
| UPDRS_Total_ON | -0.092 | 0.567 | -0.148 | 0.357 | -0.183 | 0.253 | -0.151 | 0.345 |
| HY | 0.079 | 0.625 | 0.047 | 0.772 | 0.114 | 0.476 | 0.090 | 0.576 |
| Constipation item of UPDRS | 0.494 | 0.001* | 0.470 | 0.002* | 0.529 | <0.001* | 0.555 | <0.001* |
| Drooling item of UPDRS | 0.340 | 0.029* | 0.171 | 0.284 | 0.515 | 0.001* | 0.387 | 0.012* |
| Chewing/swallowing items of UPDRS | 0.471 | 0.002* | 0.503 | 0.001* | 0.624 | <0.001* | 0.588 | <0.001* |
| Motor subtypes | ANOVA | ||||||||||
|---|---|---|---|---|---|---|---|---|---|---|---|
| Akinetic rigid | Undetermined | Tremors Dominant | |||||||||
| Mean | ± | SD | Mean | ± | SD | Mean | ± | SD | F | P-value | |
| Duration of GIT manifestations | 8.125 | ± | 3.043 | 8.792 | ± | 3.115 | 10.000 | ± | 5.074 | 0.851 | 0.435 |
| Subscore of constipation | 13.500 | ± | 4.685 | 12.917 | ± | 6.360 | 14.778 | ± | 7.067 | 0.275 | 0.761 |
| Subscore of bowel irritability | 8.450 | ± | 3.300 | 7.833 | ± | 4.589 | 7.667 | ± | 4.528 | 0.157 | 0.855 |
| Subscore of upper GI | 5.650 | ± | 3.760 | 5.917 | ± | 5.384 | 6.111 | ± | 4.485 | 0.037 | 0.964 |
| Total GIT score | 27.600 | ± | 10.164 | 26.667 | ± | 14.785 | 28.556 | ± | 15.134 | 0.057 | 0.945 |
| Unstandardized Coefficients | Standardized Coefficients | T | P-value | ||
|---|---|---|---|---|---|
| B | Std. Error | Beta | |||
| Bowel irritability | -0.196 | 0.291 | -0.214 | -0.672 | 0.506 |
| subscore.upper.GI | 0.068 | 0.252 | 0.082 | 0.270 | 0.789 |
| Total GIT score | 0.187 | 0.134 | 0.652 | 1.397 | 0.171 |
| Unstandardized Coefficients | Standardized Coefficients | T | P-value | ||
|---|---|---|---|---|---|
| B | Std. Error | Beta | |||
| Duration of illness | 1.351 | 0.923 | 0.431 | 1.464 | 0.152 |
| Duration of GIT manifestations | -0.341 | 0.949 | -0.098 | -0.359 | 0.721 |
| Domain 6-GIT | 1.556 | 1.109 | 0.242 | 1.403 | 0.170 |
| Constipation item of UPDRS | 1.737 | 2.429 | 0.118 | 0.715 | 0.479 |
| Drooling item of UPDRS | 0.115 | 1.591 | 0.009 | 0.073 | 0.943 |
| Chewing/swallowing items of UPDRS | 4.069 | 2.601 | 0.225 | 1.564 | 0.127 |
3.4. Predictors of GIDS-PD among PD Patients
Table 6 presents a multivariate linear regression analysis examining the relationship between bowel irritability, upper GI symptoms, and total GIT score with the duration of GIT manifestations. Although the total GIT score demonstrated the strongest association with the duration of GIT symptoms (standardized beta = 0.652), this relationship was not statistically significant (P = 0.171). Neither bowel irritability nor upper GI symptoms significantly predicted the duration of GIT manifestations, indicating that these GIT-related factors do not adequately explain the variability in the duration of GIT symptoms.
Table 7 presents the results of a regression analysis assessing the impact of various factors, such as duration of illness, GIT manifestations, and specific UPDRS items (constipation, drooling, and chewing/swallowing) on the total GIT score. None of the factors were significant, suggesting that these variables do not strongly influence the overall gastrointestinal symptom severity in this patient group.
4. DISCUSSION
GI symptoms are increasingly recognized as a significant non-motor feature of IPD, often preceding motor symptoms for several years. Common prodromal GI issues, such as constipation and delayed gastric emptying, have been linked to early neurodegenerative changes in the enteric nervous system [18].
Emerging research suggests that abnormal α-synuclein, a key feature of PD, may first originate in the gut and migrate to the brain via the vagus nerve, making these early GI symptoms potential biomarkers for Parkinson's disease [19]. Studies have also reported that these GI disturbances can appear years before motor symptoms, suggesting a critical window for early diagnosis [12]. This study aimed to assess the prevalence and progression of prodromal GI manifestations in IPD, providing insights into their potential role in early detection and management of the disease.
Current statistics show a significant correlation between a familial history of PD and neuropsychiatric disorders in the PD group compared to the control group. This parallels the findings of a study by Liu et al., who concluded that first-degree relatives of PD patients are more likely to develop PD and other neuropsychiatric diseases [20, 21].
In our study, GI symptoms were significantly more severe in PD patients than in the control group, as indicated by multiple measures. The mean GI symptom score on the NMSS for PD patients was 4.12 ± 1.94, significantly higher than the control group's score of 0.48 ± 0.63 (p < 0.001). This finding remains consistent with other studies that emphasize the pervasiveness of GI dysfunction in PD [20]. For instance, Lubomski et al. reported that PD patients had significantly higher rates of GI dysfunction, particularly in constipation, nausea, and bloating, with 78.6% of PD patients suffering from constipation compared to 28.4% of healthy controls. The severity of constipation in their study was also found to be four times greater in PD patients, with a notable mean difference in constipation severity scores between PD patients and controls (p < 0.001) [22].
Additionally, our use of GIDS-PD highlighted the significantly higher total GI dysfunction score in PD patients (27.54 ± 12.47) compared to controls (12.31 ± 8.74, p < 0.001). This difference underscored the multifaceted nature of GI symptoms in PD, affecting both upper and lower GI tract functions. Other research corroborates these findings, showing similar patterns of severe constipation, bowel irritability, and upper GI symptoms in PD patients. This also aligns with findings from a study by Zhang et al. [23], who found that PD patients had significantly prolonged colonic transit times and reduced rectal and anal pressure, which are key contributors to severe constipation in PD. Their study further demonstrated that PD patients had longer colonic transit times (p < 0.05) and more frequent difficulties with defecation than patients with functional constipation.
The sub-score constipation was significantly related to the duration of illness and domain 6 of GIT NMSS; such results were compatible with the findings of a study by Bo and colleagues, who concluded that constipation, dysphagia, gastroparesis, and IBS-C are more specific for PD prediction than other variables [8].
Notably, our study also revealed that 39.02% of PD patients experienced constipation, although this difference from the control group (31.03%) was not statistically significant (p = 0.492). However, the duration of constipation was significantly longer in PD patients (9.69 ± 5.21 years) compared to controls (3.22 ± 1.64 years, p = 0.002), reflecting the chronicity of GI dysfunction in PD. This finding is consistent with the results of a study by Sun et al., who reported that 52.41% of PD patients in their study experienced constipation, with an average duration exceeding 6 years [24].
Our analysis of other GI symptoms, such as GERD, also showed a significantly higher prevalence in PD patients (21.95%) compared to no reported cases in controls (p = 0.007). This reinforces the view that upper GI issues, like GERD, are common non-motor symptoms in PD. This is further supported by Lubomski et al., who also reported higher rates of indigestion (dyspepsia) (42.7%) and bloating (64.4%) in PD patients, compared to 17.3% and 14.8%, respectively, in controls [22].
5. LIMITATIONS
Despite the significant findings, this study has several limitations. First, the relatively small sample size may limit the generalizability of the results. Future studies with larger cohorts are needed to validate these findings. Second, the cross-sectional design does not allow for causal inferences or longitudinal tracking of symptom progression. A prospective study would be necessary to confirm whether early GI dysfunction predicts the onset and severity of motor symptoms over time. Third, while we identified correlations between GI symptoms and disease severity, we did not explore potential confounding factors, such as dietary habits, lifestyle, and medication effects, which may influence GI dysfunction in PD. Lastly, although we utilized validated GI assessment tools, incorporating objective biomarkers, such as gut microbiota analysis or colonic transit studies, would provide deeper insights into the underlying mechanisms of GI dysfunction in PD.
CONCLUSION
This study underscores the significant role of gastrointestinal (GI) dysfunction as an early, prodromal feature of idiopathic Parkinson’s disease (PD). We found that PD patients exhibited significantly more severe GI symptoms than healthy controls, with constipation, drooling, and dysphagia being the most prevalent. Importantly, these symptoms often preceded motor manifestations over several years, reinforcing the hypothesis that GI dysfunction may serve as an early clinical marker for PD.
The strong correlations observed between GI symptoms, disease duration, and key Parkinsonian motor scores suggest a potential gut-brain axis involvement in PD pathogenesis. These findings add to the growing body of evidence supporting the early detection of PD through non-motor symptoms and highlight the importance of incorporating GI assessments into clinical practice for at-risk individuals. Given the chronic and progressive nature of GI symptoms in PD, incorporating GI screening tools, such as the Gastrointestinal Dysfunction Scale for Parkinson’s Disease (GIDS-PD), into routine neurological evaluations could facilitate earlier diagnosis and intervention.
AUTHORS' CONTRIBUTIONS
N.K.: Conceived and designed the study and wrote the manuscript and references; M.Y.B.: Collected cases, conducted the practical part, recruited and interviewed participants, and analyzed the data; M.N.: Analyzed, tabulated, and wrote the results section.
LIST OF ABBREVIATIONS
| PD | = Parkinson’s Disease |
| NMS | = Non-motor Symptoms |
| GI | = Gastrointestinal |
| LBs | = Lewy Bodies |
| ENS | = Enteric Nervous Systems |
| SIBO | = Small Intestinal Bacterial Overgrowth |
| GIDS-PD | = Gastrointestinal Dysfunction Scale for Parkinson’s Disease |
ETHICS APPROVAL AND CONSENT TO PARTICIPATE
Ethical approval was obtained from the Tanta University Research Ethics Committee (REC) before commencing the study (No. 36264PR341/9/23).
HUMAN AND ANIMAL RIGHTS
All procedures performed in studies involving human participants were in accordance with the ethical standards of institutional and/or research committee and with the 1975 Declaration of Helsinki, as revised in 2013.
AVAILABILITY OF DATA AND MATERIALS
The data and supportive information are available within the article.
ACKNOWLEDGEMENTS
Declared none.