All published articles of this journal are available on ScienceDirect.

Insulin Sensitivity / Insulin Resistance as Predictors of Esophageal Varices in Post Chronic Hepatitis C Virus Patients
Authors Info & Affiliations
Abstract
Background:
Screening of Esophageal Varices (EV) in liver cirrhosis is highly recommended in all consensus reports. The standard screening procedure is endoscopy. Insulin resistance (IR) and the quantitative insulin sensitivity check index (QUICKI) are reliable predictors of portal hypertension.
Objective:
The study aimed to assess and compare the validity of insulin sensitivity/insulin resistance markers and other non-invasive markers for the detection of EVs in post chronic hepatitis C virus cirrhotic patients.
Patients and Methods:
In this cross-sectional study, 76 patients were screened by esophagogastroduodenoscopy and abdominal ultrasonography. Estimation of fasting serum insulin by ELISA technique was carried out. Homeostasis model assessment of insulin resistance (HOMA-IR) and QUICKI was performed.
Results:
The patients with an advanced grade of EV had higher insulin resistance and lower QUICKI. A cut-off value of HOMA-IR ≥ 3.4 could significantly predict EVs with 72% sensitivity and 80.0% specificity. Spleen diameter and platelet count/spleen diameter ratio (PC/SD) showed a significant difference among groups.
Conclusion:
Lower insulin sensitivity (assessed by QUICKI) and higher insulin resistance (assessed by HOMA IR) were good non-invasive predictors of EVs. In addition, portal vein (PV) diameter, spleen diameter, and PC/SD were also found as predictors of EVs.
1. INTRODUCTION
The development of esophageal varices (EV) is the most common complication in liver cirrhosis. Depending on the clinical degree of liver cirrhosis, EVs are present in 30%-40% of patients with compensated cirrhosis, but they can also be present in up to 85% of decompensated cirrhotic patients [1].
Variceal bleeding is a life-threatening disease occurring in 5% of small EV patients and up to 15% of patients with large esophageal varices. The death risk per episode of bleeding is between 10% to 20% [2, 3]; the higher difference in the percentage of variceal bleeding between Egypt and western countries (which might reach 56.29% [4] in the elderly) could be explained by the fact that Egypt has the highest prevalence rate of hepatitis C viral infection (HCV) worldwide (15%–20%) in addition to hepatitis B (3.2%) and bilharzial infestation, which are considered major risk factors for the high incidence of chronic liver diseases with a sequel of variceal bleeding [5, 6]. Thus, EV screening in patients with liver cirrhosis is highly recommended in all consensus reports [7-9]. The standard screening procedure is endoscopy in patients without EV at 2-3 years and in patients with small EV at 1-2 years [10].
The non-invasive methods for EV prediction consist of serum markers, imaging, measurement of liver stiffness, and a combination of these methods. Serum markers mostly consist of alanine and aspartate aminotransferase (ALT and AST), alkaline phosphatase, gamma-glutamyltranspeptidase, platelet count, and clinical variables. Imaging markers mostly consist of portal vein diameter, spleen diameter, and PC/SD [11].
Transient elastography is utilized to assess hepatic stiffness as it is non-invasive, easily performed with immediate results, and has good reproducibility [12].
Insulin resistance is the real determinant of both nonalcoholic fatty liver disease (NAFLD) and diabetes and can facilitate the accumulation of triglycerides in the liver [13]. The relationship between insulin resistance (IR) and hepatic hemodynamics as more reliable predictors of portal hypertension has been studied in several studies [14]. Increased resistance to insulin is also associated with chronic disease of the liver [15].
Insulin resistance is characterized by the reduction in the glucose disposal rate caused by the concentration of insulin [16].
According to Erice et al. [5], secondary hyperinsulinemia (abnormally high levels of insulin in the body relative to the level of glucose.) may develop due to one of the two mechanisms. If a hepatic venous pressure gradient (10 mmHg) [clinically significant PH (CSPH)] is developed; either pancreatic hyper-secretory state, as suggested by moderately higher C-peptide levels in patients with IR, or reduced insulin clearance as a result of Porto-systemic PH leads to secondary hyperinsulinemia. However, it is not linked to any underlying hepatocellular or endothelial disease [17].
The “gold standard” for insulin-sensitivity assessment is hyperinsulinemic euglycaemic clamp (HEC(. However, it is time-consuming and expensive, leading to the need for a simplistic approach to insulin sensitivity quantification [18].
Matthews et al. initially developed a homeostasis model assessment (HOMA model) in 1985. It is a tool used to measure tolerance to insulin and beta-cell function from concentrations of fasting levels of both glucose and insulin (or C-peptide). The HOMA model has been a successful clinical and epidemiological method for insulin resistance assessment [19].
QUICKI is a reliable and accurate approach based on a mathematical translation of fasting blood glucose and plasma insulin concentrations produced empirically [20].
The linear association between QUICKI and glucose clamp is much greater. Many studies have found that QUICKI and glucose clamp values have excellent linear correlations [21-23].
Many studies have investigated the validity of insulin resistance for the detection of esophageal varices. The aim of the study was to assess the validity of insulin sensitivity and compare it to insulin resistance markers and other non-invasive markers for the detection of esophageal varices in post chronic hepatitis C virus cirrhotic patients.
2. PATIENTS AND METHODS
This cross-sectional research was conducted on 95 patients who attended Tanta University Hospital's Department of Tropical Medicine.Before the beginning of the research, approval was taken from the Institutional Ethical Committee (approval code number:344447\ 2\ 21).
For all study participants, the objective of the analysis was made transparent, and every patient signed informed consent before getting enrolled.The study data were accessed by all the contributors, and the final text was checked and authorized.
2.1. Inclusion Criteria
Patients were included after they had a diagnosis of HCV-induced cirrhosis based on histopathological examination of liver biopsy whenever available or clinical criteria based on history, physical examination, laboratory parameters, and imaging findings.
2.2. Exclusion Criteria
Patients with other causes of liver disease or mixed etiology, patients with portal vein thrombosis, patients with any malignancies or any endocrinal disorders, and those with BMI greater than or equal to 30 kg/m2 were excluded from the study.
All the patients underwent a full clinical examination, routine laboratory investigation, calculation of Child-Pugh classification, calculation of body mass index, and esophagogastroduodenoscopy (EGD) within two weeks of laboratory parameter investigation. A skilled endoscopist used a Pentax EG-2985 to perform the endoscopy. The upper gastrointestinal tract was examined up to the proximal duodenum.
Patients with morbid obesity (4 patients), renal failure (5 patients), endocrinal distress (6 patients), and febrile illness (4 patients) were excluded. Therefore, 76 patients who met the inclusion criteria were randomized into three groups: Group I included 26 cirrhotic patients without esophageal varices; Group II included 25 cirrhotic patients with small esophageal varices (grade I and II); Group III included 25 cirrhotic patients with large esophageal varices (grade III and VI). Clinical evaluations were performed on the patients. The grade of varices was determined using the Baveno IV classification system [7].
All patients underwent liver function tests, prothrombin time and activity, blood urea and serum creatinine, a complete blood picture, and viral hepatitis markers for HCV and HBV done in the laboratory. Each patient also had abdominal ultrasonography, conducted at the Tropical Medicine Department using a Toshiba 770 25A with the convex probe; 3.5MH. Professional specialists assisted in calculating the portal vein diameter and maximal spleen bipolar diameter.
The ELISA method was used to test the estimation of fasting serum insulin [24].
2.3. Principle of the Procedure
The Mercodia Ultrasensitive Insulin ELISA is a two-site enzyme immunoassay in the solid phase. It is based on a direct sandwich method in which two monoclonal antibodies are directed against different antigen determinants on insulin molecules by two monoclonal antibodies. They interact with peroxidase antibodies conjugated to anti-insulin and insulin-binding antibodies to the microplate during insulin incubation in the sample. Unbound enzyme-labeled antibody is removed with a simple washing step. A reaction of 3, 3', 5, 5'-tetramethylbenzidine detects the bound conjugate. By adding acid, the reaction is terminated, resulting in a colorimetric outcome that can be interpreted spectrophotometrically.
Manual calculation: 1. The absorbance values obtained for the calibrators were plotted, except for Calibrator 0, against the insulin concentration on a log-log paper, and a calibrator curve was constructed; 2. The concentration of the samples was read from the calibrator curve.
HOMA-IR was calculated using the United States (US) Formula:
fasting glucose (mg/dl) x fasting insulin (μIU /mL) /405,
Where no insulin resistance was below 3, moderate insulin resistance was 3-5, and severe insulin resistance was more than 5 [25].
QUICKI can be determined from fasting plasma glucose (mg/dl) and insulin (μIU/ml) concentrations [20].
QUICKI = 1/ (logI0 + logG0)
The reported values of QUICKI were 0.382 ± 0.007 for non-obese, 0.331 ± 0.010 for obese, and 0.304 ± 0.007 for diabetic individuals.
2.4. Statistical Analysis
Data were analyzed using the Statistical Package for Social Sciences program (SPSS), version 20.0. Results were expressed as frequency, percentage, and mean ± S.D. For quantitative data analysis, One-way analysis of variance ANOVA was used to detect the difference in mean between groups, followed by Tukey's test. The receiver operating characteristic curve (ROC curve) and 95% confidence interval were performed to determine the cut-off values for the studied biomarkers. Sensitivity, specificity, positive predictive value (PPV), and negative predictive value (NPV) were determined. P-values < 0.05 were considered statistically significant.
3. RESULTS
The mean age of all the included participants was 52.65 ± 7.55 years. Eighty-four percent were males, and 15.7% were females. Only 8 patients of all the studied patients (10.53%) had diabetes. The whole cases mean Child-Pugh score was 8.30 ± 1.97. All of the patients had a mean body mass index (BMI) of 24.9± 2.2 kg/m2. In terms of liver function tests, there was no statistically significant difference between the investigated groups (P > 0.05) except for serum albumin (P = 0.003). Group III had lower albumin than group II (P = 0.009), and group III had lower albumin than group I (P = 0.009) (Table 1).
Regarding fasting and 2h postprandial blood glucose levels, there was no statistically significant difference among the three studied groups. The mean values of fasting blood glucose were 97.31±14.97, 100.76 ± 16.90, and 104.76± 24.05 in groups I, II, and III, respectively. Postprandial blood glucose mean values were 147.15±19.81, 163.56±62.52, and 173.6±40.92 in groups I, II, and III, respectively (Table 1).
3.1. Insulin Resistance According to HOMA-IR Score of the Studied Groups
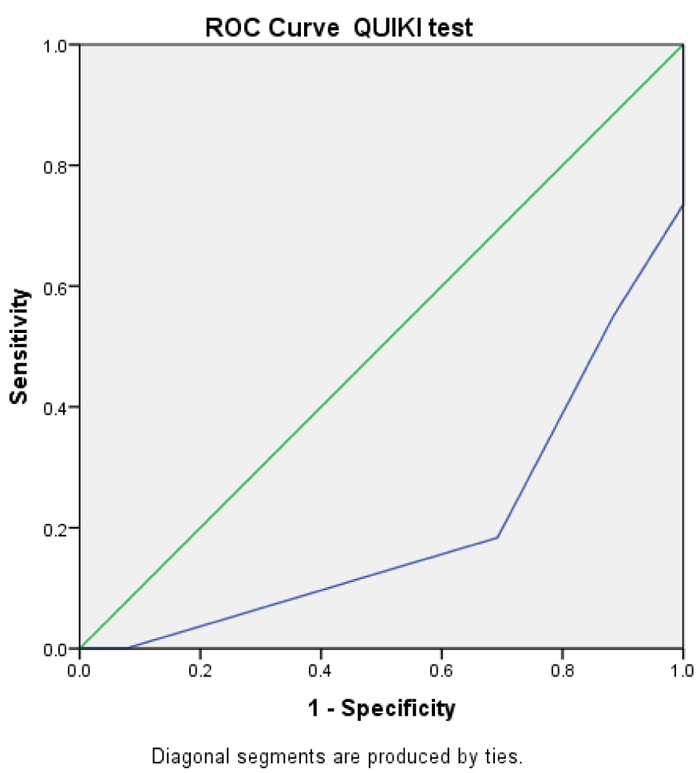
There was a statistically significant difference among the three groups (P<0.05), as the patients with an advanced grade of EV had higher insulin resistance. The mean values of the mean HOMA IR were: 2.92 ± 0.55, 3.82 ± 1.16, and 4.42 ± 1.48 in groups I, II, and III, respectively. The same was also recorded by QUIKI IR, as shown in Table 1 and Fig. (1).
Table 2 presents the radiological and abdominal ultrasonography findings (spleen size and portal vein diameter) in the studied groups. Regarding Portal Vein Diameter (PVD), group III had a significantly higher PV diameter than both group I and group II with a mean value of 13.23 mm ±2.01 in group I, 13.80 mm ± 2.18 in group II, and 15.56 mm ±2.08 in group III.
3.2. Spleen Diameter
It showed a significant difference among the three groups. It increased with the increasing grade of OV; however, only group III had a significantly higher splenic diameter than group I and group II. The mean value of splenic diameter in group I was 15.89 cm ±2.70, in group II, it was 16.96 cm ± 2.99, and in group III, it was 19.65 cm ±2.98.
3.3. Platelet Count/Spleen Diameter Ratio (PC/SD)
It showed a statistically significant difference among the three groups (P<0.001). The Post Hoc test showed a significant difference between group I and group II (P = 0.000) and between group I and group III (P =0.000); this means that the PC/SD ratio has a significant inversely proportional relationship with the grade of EV (Table 1).
In an attempt to find significant predictive factors of esophageal varices, Receiver Operator Characteristic (ROC) curve analysis was carried out (Table 3).
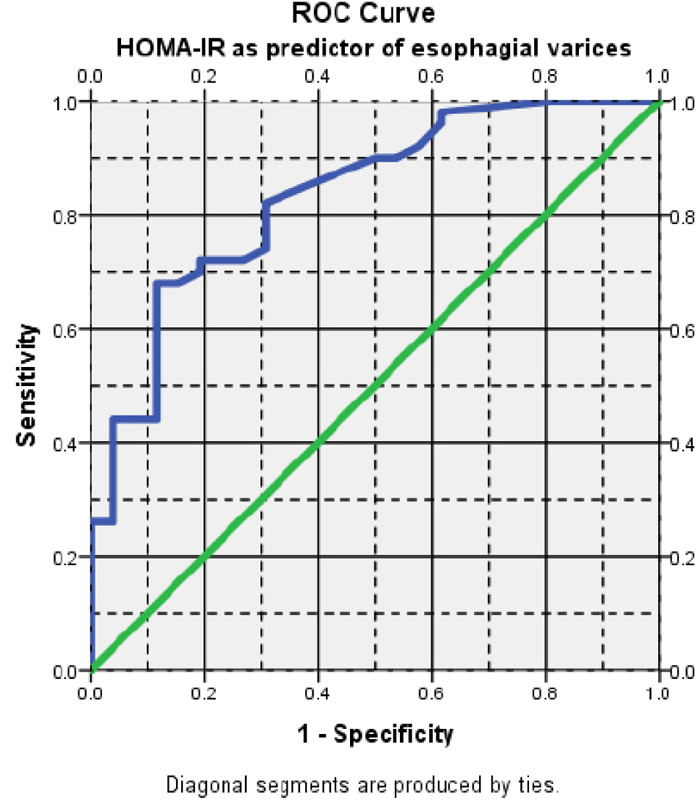
Regarding insulin resistance, a cut-off value of ≥ 3.4 could significantly predict EV (AUROC= 0.834) with 72% sensitivity, 80.0% specificity, 83.7% positive predictive value (PPV), and 57.6% negative predictive value (NPV). This denotes that HOMA-IR is a good diagnostic test for the presence of EV (Fig. 2).
For portal vein diameter, a cut-off value of ≥13.1 mm could predict EV (AUROC= 0.688) with 74.0% sensitivity, 61.5% specificity, 78.7% PPV, and 55.2% NPV (Table 3, Fig. 3).
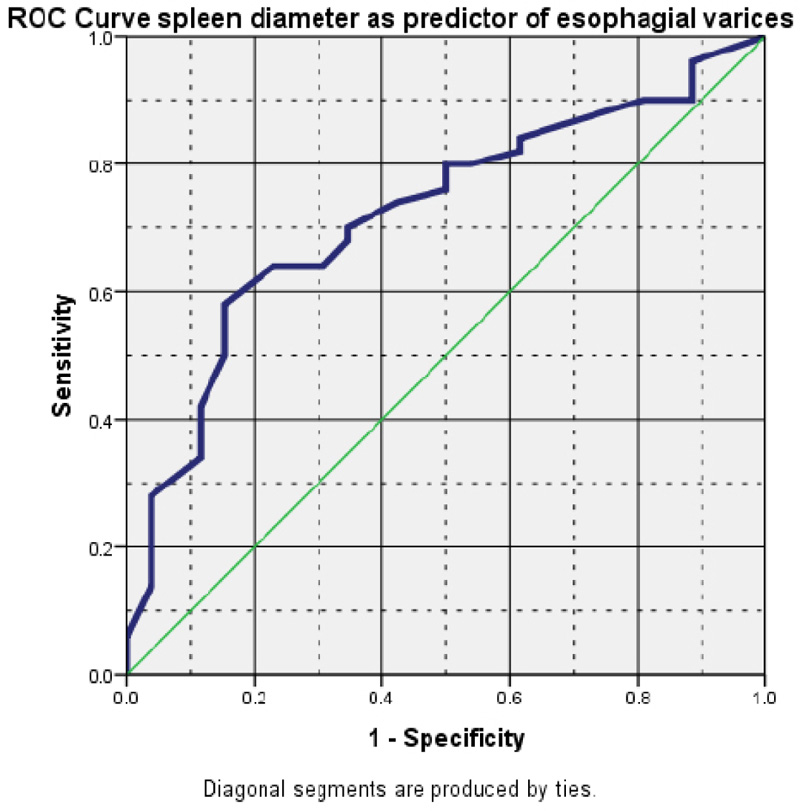
Regarding spleen diameter, a cut-off value of ≥ 16.6 cm could predict EV (AUROC= 0.723) with 70% sensitivity, 65.4% specificity, 79.5% PPV, and 53.1% NPV (Table 3, Fig. 4).
| Group I= 26 | Group II=25 | Group III=25 | ANOVA | |||
|---|---|---|---|---|---|---|
| Variable | Mean + SD | Mean + SD | Mean + SD | F | P | Post-hoc |
| Age | 52.39 ± 6.85 | 53.92 ± 7.68 | 51.68 ± 8.22 | 0.569 | 0.568 | |
| BMI | 24.55 ± 2.26 | 24.26 ± 1.92 | 25.90 ± 2.16 | 4.23 | 0.018* | P1 0.880 P2 0.067 P3 0.022* |
| Child Pugh score | 8.42 ± 2.08 | 7.32 ± 1.78 | 9.16 ± 1.65 | 6.296 | 0.003* | P1 0.09 P2 0.34 P3 0.002* |
| RBCs (106/mm3) | 3.73 ± 0.64 | 3.52 ± 0. 82 | 3.48 ± 0.57 | 1.005 | 0.371 | |
| Platelets (103/mm3) | 121230.77± 34990.64 | 79800.08± 32055.74 | 93080.00 ± 25460.62 | 11.806 | 0.000* | P1 0.000* P2 0.003* P3 0.434 |
| Albumin (g/dl) | 2.98 ± 0.49 | 2.98 ± 0.43 | 2.59 ± 0.42 | 6.168 | 0.003* | P1 1.000* P2 0.009* P3 0.009* |
| International normalized ratio INR | 1.59 ± 0.51 | 1.43 ± 0.21 | 1.66 ± 0.42 | 2.295 | 0.108 | |
| FBG(mg/dl) | 97.31±14.97 | 100.76 ± 16.90 | 104.76± 24.05 | 0.982 | 0.379 | |
| 2 hour post prandial blood glucose (mg/dl) | 147.15±19.81 | 163.56±62.52 | 173.6±40.92 | 2.313 | 0.106 | |
| AST (U/L) | 63± 29.72 | 60.28 ± 25.21 | 65.16± 18.27 | 0.241 | 0.787 | |
| ALT (U/L) | 40.12± 18.09 | 34.36 ± 17.01 | 44.0± 15.56 | 2.051 | 0.136 | |
| HOMA IR | 2.92 ± 0.55 | 3.82 ± 1.16 | 4.42 ± 1.48 | 11.306 | 0.000 | P1 0.016* P2 0.000* P3 0.161 |
| QUIKI | 0.32 ± 0.008 | 0.316 ± 0.010 | 0.309 ± 0.015 | 13.975 | 0.000 | P1 0.008* P2 0.000* P3 0.097 |
| Fasting insulin (Mu/l) | 12.25 ± 1.87 | 15.31 ± 2.96 | 16.96 ± 3.78 | 16.613 | 0.000 | P1 0.001* P2 0.000* P3 0.132 |
| Total Bilirubin (mg/dl) | 2.45 ± 2.18 | 2.14 ± 1.96 | 2.90 ± 1.95 | 0.885 | 0.417 | |
Group II = cirrhotic patients with small varices.
Group III = cirrhotic patients with large varices; P1--- no varices/ small varices; P2--- no varices/ large varices; P3 ---small varices/ larg varices.
* < 0.05
| Variable | Group I= 26 | Group II=25 | Group III=25 | ANOVA | ||
|---|---|---|---|---|---|---|
| Mean ± SD | Mean ± SD | Mean ± SD | F | p | Post Hoc | |
| PV diameter (mm) | 13.23±2.01 | 13.80 ± 2.18 | 15.56 ±2.08 | 8.525 | 0.000* | P1 0.588 P2 0.000* P3 0.011* |
| Spleen diameter (cm) | 15.89 ±2.70 | 16.96 ± 2.99 | 19.65 ±2.98 | 11.316 | 0.000* | P1 0.386 P2 0.000* p3 0.005* |
| Platelet count/spleen diameter | 799.44 ± 266.99 | 488.04 ±187.10 | 460.24±138.66 | 17.195 | 0.000 | P1 0.000* P2 0.000* P3 0.947 |
| ROC curve result |
Insulin Resistance
HOMAIR |
PVD | Spleen Diameter |
|---|---|---|---|
| Area under the curve | 0.834 | 0.688 | 0.723 |
| Cut off value | ≥ 3.4 | ≥13.1 | ≥ 16.6 |
| Sensitivity | 72% | 74% | 70% |
| Specificity | 80% | 61.5% | 65.4% |
| Postive predictive value | 83.7% | 78.7% | 79.5% |
| Negative predictive value | 57.6% | 55.2% | 53.1% |

4. DISCUSSION
The initiation of EV is well known to be a critical turning point in the clinical progression of liver disease. As a result, the latest guideline recommendations stated that once cirrhosis is diagnosed, all patients should undergo endoscopic screening for varices and routine periodic assessment [26].
Non-invasive methods for predicting the existence of esophageal varices would give a tool for identifying individuals who might benefit from endoscopy, thus reducing unnecessary endoscopy. This would make patient care more cost-effective, especially in areas where endoscopy is unavailable and liver cirrhosis is common. If non-invasive tests employed for first-line selection are sufficiently accurate to distinguish endoscopic necessity, selective screening endoscopy would be more cost-effective than universal screening endoscopy [27].
To the best of our knowledge, this is the first study to evaluate the insulin sensitivity assessed by QUIKI in the prediction of EV. QUIKI showed a statistically significant difference among studied groups (p-value = 0.008 and 0.000), respectively, denoting its ability to predict the presence of EV.
In our study, there was a statistically significant difference among the three groups regarding fasting insulin and HOMA IR, as the patients with an advanced grade of EV had higher insulin resistance (higher HOMA IR and lower QUIKI). HOMA-IR is a good diagnostic test for the prediction of EV. A cut-off value of ≥ 3.4 of HOMA IR had 72% sensitivity and 80% specificity.
Our findings were consistent with those of Camma et al. who found that HOMA-IR of greater than 3.5, independent of diabetes, substantially predicts the occurrence of EV in patients [27].
Moreover, our results were in agreement with the findings of studies conducted by Eslam et al., Wasfy et al., and Abu El Makarem et al., who found that the cut-off value for the HOMA-IR score of greater than 3 was the optimal value for accurate prediction of EVs with different sensitivity and specificity [28-30].
The diverse ethnic groups of patients may cause disparities in the results of the studies. Patients with various etiological causes for cirrhosis, such as alcohol, HCV, HBV, and others, might contribute to this discrepancy, according to the study of Eslam et al. [28], which was conducted in two centers (in Spain and Egypt). This positive association of insulin resistance in the prediction of EVs can be attributed to insulin stimulation of endothelial lining malfunction, which is a significant early event in vascular diseases.
Insulin can change the endometrial nitric oxide and endothelial structure [30]. It can also promote the synthesis of tumor necrosis factor-alpha and connective tissue growth factor and activate hepatic stellate cells (HSC), which play an important role in the development of liver cirrhosis and PH [31].
In our study, a cut-off value of ≥13.1 mm of the portal vein diameter could predict EV (AUROC= 0.688) with 74.0% sensitivity, 61.5% specificity, 78.7% PPV, and 55.2% NPV.
A cut-off value of ≥13 mm of the portal vein was supported by multiple studies with high specificity and sensitivity [29-33].
On the other hand, Prihatini et al. and Sarwar et al. considered a portal vein diameter of 11.5 mm a predictive factor for esophageal varices in liver cirrhosis [34, 35].
In our study, a cutoff value of ≥ 16.6 cm of splenic size could predict EV (AUROC= 0.723) with 70% sensitivity, 65.4% specificity, 79.5% PPV and 53.1% NPV. According to Wasfy et al., a cut-off value of 15.65 could significantly predict EV.
In agreement with our results, other studies also postulated that a spleen size larger than 13 cm predicts the development of gastroesophageal varices in cirrhotic patients [33, 36].
Since platelet count alone may be misleading as it can not be solely attributed to portal hypertension, the platelet count/spleen diameter ratio is a parameter linking splenomegaly implicated in thrombocytopenia of cirrhosis with spleen size being inversely proportional to platelet count [37].
The platelet count/spleen diameter ratio was also used by Giannini et al. to predict esophageal varices. This ratio links thrombocytopenia to splenomegaly to introduce a variable that considers that thrombocytopenia is mainly due to hypersplenism secondary to portal hypertension [38, 39].
The platelet count/spleen diameter ratio (PC/SD) was shown to be statistically significant among the three groups, indicating the manifestation of EV in our study.
The role of PC/SD in the prediction of EV was also supported by Camma et al. in 2009, Esmat et al. in 2012, Abu El Makarem et al. in 2011, and Badawi et al. in 2020 [27, 30, 38, 40].
5. LIMITATION
The study was a single-center study with a limited number of patients and a small sample size. More studies on a larger number of patients are needed.
CONCLUSION
Lower insulin sensitivity (assessed by QUIKI) and higher insulin resistance (assessed by HOMA IR) are good non-invasive predictors of EV. In addition, PV diameter, spleen diameter, and PC/SD are observed as predictors of esophageal varices.
AUTHORS' CONTRIBUTION
All the authors participated in the study and approved the final version of the manuscript.
ETHICS APPROVAL AND CONSENT TO PARTICIPATE
The study was approved by the Ethical Committee of the Faculty of Medicine, Tanta University, Tanta, Egypt, (approval number344447\ 2\ 21).
HUMAN AND ANIMAL RIGHTS
No animals were used in this research. All human research procedures followed in the study were according to the ethical standards of the committee responsible for human experimentation (institutional and national) and the Helsinki Declaration of 1975, as revised in 2013.
CONSENT FOR PUBLICATION
All patients participated voluntarily and gave their informed consent.
STANDARDS OF REPORTING
STROBE guidelines and methodologies were followed.
AVAILABILITY OF DATA AND MATERIALS
The datasets used and/or analyzed during the current study are available from the corresponding author [S.A.E], on reasonable request.
FUNDING
None.
CONFLICT OF INTEREST
The authors declare no conflict of interest, financial or otherwise.
ACKNOWLEDGEMENTS
Declared none.