All published articles of this journal are available on ScienceDirect.

Combination of Albumin-Bilirubin Grade and Platelet Count as a Predictor of Esophageal Varices’ Presence and Grading in Egyptian Patients with HCV Related Cirrhosis
Authors Info & Affiliations
Abstract
Background:
Screening guidelines recommend that all patients who are newly diagnosed with cirrhosis should be screened for esophageal varices (EV). This study aimed at predicting the presence of esophageal varices among Egyptian hepatitis C cirrhotic patients by a combination of albumin-bilirubin grade and platelet count score (ALBI-Platelet score).
Methods:
This study was performed on 150 cirrhotic patients. Eighty- seven patients with hepatitis C virus (HCV) related cirrhosis and esophageal varices formed Group (A), while Group (B) consisted of sixty-three patients with HCV related cirrhosis and no esophageal varices. Full metabolic profile, Complete blood count (CBC), ultrasonography, and endoscopy were done.
Results:
There was a significant difference between studied groups regarding serum bilirubin, serum albumin and platelet count. The cutoff point of platelets count as a predictor for esophageal varices among studied groups was <154.5. The cutoff value for albumin-bilirubin (ALBI) score as a predictor for esophageal varices of any size was -1.67 with 52.9% sensitivity, 59.6% specificity, 47% negative predictive value (NPV) and 64% positive predictive value (PPV). The ALBI-Plt score >3 had 42.5%, specificity 63.5%, negative predictive value 40% and positive predictive value 65%. The cutoff value for the ALBI score representing large-sized esophageal varices was -1.27. The ALBI-Plt score >4 for large-sized varices had sensitivity 61.9%, specificity 55%, negative predictive value 59%, positive predictive value 50%.
Conclusion:
ALBI-Platelet score is a non-costly, readily available and reliable new non-invasive predictor of the presence of EV that could easily be used in screening for the presence of esophageal varices and risky large-sized esophageal varices in cases of hepatitis C Virus related hepatic cirrhosis, lessening the need for endoscopic screening.
1. INTRODUCTION
Cirrhosis is a liver disease characterized replacement of liver tissue by fibrosis and regenerative nodules [1]. The loss of liver function is the result of these changes: Chronic hepatitis C (HCV), chronic hepatitis B (HBV), and non-alcoholic fatty liver disease (NAFLD) are the most common causes of cirrhosis [2, 3].
Portal hypertension (PH) is characterized as a greater than 5 mmHg increase in the portal venous pressure gradient (PVPG) between the portal vein (PV) and inferior vena cava (IVC) as a result of changes in portal resistance and portal inflow [4].
The development of portosystemic collateral veins, of which EV have the greatest clinical effect and the most extreme complications, requires an elevation of PVPG more than 10 mmHg [5].
All patients newly diagnosed with cirrhosis should be screened for EV, according to current recommendations. Endoscopy should also be repeated at a 2-3 year interval in patients without varices and at a 1-2 year interval in patients with small varices to assess development [6]. The cost of screening all patients with endoscopy, on the other hand, will be considerably higher, and patient compliance will be variable [7].
As hepatic fibrosis contributes to elevated intrahepatic vascular resistance, various non-invasive markers have been evaluated for their correlation with hepatic venous pressure gradient (HVPG) in cirrhotic patients, such as a model for end-stage liver disease (MELD), aspartate aminotransferase (AST) to alanine aminotransferase (ALT) ratio (AST/ALT), aspartate aminotransferase to platelet ratio index (APRI), platelet count to spleen diameter (PC/SD), fibrosis-4-index (FIB-4), Lok index, fibrosis index (FI) and King’s score [8]. They have been shown to be simple, non-invasive, realistic alternatives for evaluating the severity of chronic liver disease and also for detecting esophageal varices in cirrhotic patients [9]. Both the APRI and Lok index have shown reliable performance for predicting PH [10, 11]. The Platelet count and splenic diameter ratio proved to have high accuracy for the prediction of esophageal varices as it has been found that platelet count less than 120× 103/μL and spleen size diameter more than13.6 cm could be used as a predictors of the presence of esophageal varices in cirrhotic patients [12]. The current Baveno VI consensus suggests that a combination of liver stiffness measured by transient elastography and platelet count could be applied to select patients with compensated advanced chronic liver disease who do not require endoscopic screening of esophageal varices [13]. Using conventional Ultrasonography can detect the development of portal hypertension by measuring portal vein diameter, velocity of flow, flow reversal, spleen size and portosystemic collaterals [14].
A newly developed, simple, and objective scoring method for predicting esophageal varices in patients with advanced liver disease is a combination of albumin-bilirubin grade and platelet count. The ALBI-platelet score is done by calculating albumin-bilirubin grade and platelet count points (1 point for platelet count >150,000/mm3 and 2 points for platelet count ≤150,000/mm3) [15].
This study aimed at evaluation of the possibility of utilization of a combination of albumin bilirubin grade and platelet count score in prediction of the existence of esophageal varices in Egyptian cirrhotic hepatitis C patients.
2. MATERIALS AND METHODS
During a 6-month period, 150 consecutive cirrhotic patients were screened for esophageal varices at the endoscopy unit of Tanta University hospitals' Tropical Medicine and Infectious Diseases department. All participants in the study gave their written informed consent. The research was accepted by Tanta University's Faculty of Medicine's Ethical Committee.
The following groups of patients were formed:
Group (A): Eighty- seven patients with HCV-related cirrhosis and esophageal varices.
Group (B): Sixty-three patients with HCV-related cirrhosis but no esophageal varices.
Patients with hepatic encephalopathy or coma, portal vein thrombosis, hepatocellular carcinoma, active bleeding or a history of upper gastrointestinal bleeding, prior endoscopy, prophylactic drugs to lower portal hypertension such as non–selective beta-blockers, and/or any medication that could influence platelet count or bilirubin levels were all excluded from the study.
A complete history was taken, as well as clinical and general examinations. Clinically, patients were classified using the updated Child-Turcotte-Pugh system. Child A receives 5-6 points, Child B receives 7-9 points, and Child C receives 10-15 points [16]. The existence of esophageal varices and the grade discrimination were determined using upper esophagogastroscopy [17].
Liver function tests (total bilirubin, serum albumin, alanine transaminase (ALT), aspartate transaminase (AST), prothrombin time and activity, and international normalized ratio (INR), renal function tests (urea and creatinine), complete blood count, and erythrocyte sedimentation rate (ESR) were all performed. Each patient had an abdominopelvic ultrasound scan to visualize the liver, portal venous system, spleen, collaterals, and other abdominal organs.
2.1. Calculations Included
The MELD score= 3.78× (serum bilirubin) + 11.2× (INR) + 9.57 × (serum creatinine) + 6.43.
The ALBI grade = -0.085×(albumin g/L) + 0.66×log(bilirubinμmol/L)
The ALBI grades: ALBI I ≤ − 2.60, ALBI II > − 2.60 to ≤ − 1.39 and ALBI III > − 1.39 [15].
The ALBI-PLT score was calculated by adding the ALBI grade and points for platelet count (1 point for platelet count >150,000/mm3 and 2 points for platelet count ≤ 150,000/mm3). The ALBI-PLT ranges from 2 to 5 [18].
2.2. Statistical Analysis of Data
The statistical analysis software (SPSS) was used to perform statistical analysis on the data (SPSS Inc. Released 2015. IBM SPSS statistics for windows, version 23.0, Armnok, NY: IBM Corp.). Quantitative data were provided as mean ± standerd deviation (SD), median, and qualitative data as number and percent. To find a correlation between two or more qualitative variables, the Chi-squared (χ2) or Fischer exact tests were used. For comparison between two groups of quantitative variables and independent parametric results, the Student t-test was used. For comparison between two groups of quantitative variables and independent non-parametric results, the Mann-Whitney test was used. For different potential diagnostic test or marker cut-offs, the Receiver Operating Characteristics (ROC) curve was used. P-value ≤ 0.05 to be statistically significant.
3. RESULTS
As regards Child-Pugh score there was a significant difference between the two studied groups (p-value = 0.054); however, there was no significant difference between the two studied groups as regards the MELD score (P-value = 0.7) (Table 1).
Patients of group A had a significantly lower mean platelet counts 117.42 ± 57.2 /mm3 (median=105), than patients of group B 147.38 ± 53.76 /mm3 (median=142) (p-value = 0.001) (Table 2).
The mean serum albumin level was lower in group A (2.78±0.70 mg/dl)) than in group B (3.01±0.7mg/dl)) with a significant difference between the groups (p-value=0.048). whereas the mean serum bilirubin level in group A (1.72±1.41mg/dl) was higher than in group B (1.15±1.2mg/dl) (p-value=0.001) (Table 3).
By ultrasound scanning, there was a significant difference as regards the longitudinal splenic diameter (LSD) between the two studied groups, with the mean being longer in patients from group A (16.21 ± 3.83 cm and median 16 cm) than those from group B;(14.50 ± 4.03 cm and median 13cm) (P-value is 0.01). There was a significant difference as regards portal vein diameter (PVD) between the two studied groups, in the group A; mean was 12.45 ± 2.77 mm and median 12 mm and in the group B; mean was 10.20 ± 2.06 mm and median 10 mm (P-value is 0.001) (Table 4).
As regards ALBI score, in group A, mean was (-1.45 ± 0.69) and median (-1.5) and in group B, mean was (-1.81 ± .64) and median (-1.89) with a statistically significant difference between the two groups (p-value=0.001) (Table 5).
There was a significant statistically difference (P-value =0.057) between the two groups regarding ALBI-platelet score. The scores 2, 3, 4, and 5 were respectively recorded in 1 (1.15%), 29 (33.34%), 50 (57.47%), and 7 (8.04%) patients from group A. The scores 2, 3, 4, and 5 were respectively recorded in 2 (3.17%), 27 (42.86%), 28 (44.45%), and 6 patients (9.52%) from group B (Table 6).
Univariate analysis for platelet count as a predictor for esophageal varices among the studied groups revealed a cutoff point to be<154.5 (P-value=0.046). ROC curve indicated a sensitivity of 30.2%, a specificity of 79.8%, NPV of 45% and PPV of 68% (Fig. 1).
| Child-Pugh Class | Group A | Group B | Test of Sig. | P-Value | ||
| No=87 | No=63 | |||||
| No | % | No | % | |||
| Child A | 29 | 33.3 | 33 | 52.3 | χ2 | 0.054 |
| Child A | 41 | 47.2 | 23 | 36.6 | 5.8 | S |
| Child A | 17 | 19.5 | 7 | 11.1 | ||
| MELD Score | ||||||
| Mean ± SD | 25.51 ± 6.69 | 24.9 ± 6.31 | U= | 0.709 | ||
| Range | Oct-43 | Oct-45 | 0.359 | Ns | ||
| Median | 24 | 24 | ||||
| CBC |
Group A No=87 |
Group B No=63 |
Test of Sig. | P-Value |
| Platelets × 103/mm3 | U 3.56 |
0.001 HS |
||
| Mean ± SD | 117.42 ± 57.2 | 147.83 ± 53.76 | ||
| Range | 52-262 | 75-302 | ||
| Median | 105 | 142 | ||
| - |
Group A No=87 |
Group B No=63 |
Test of Sig. | P-Value |
| Total bilirubin mg/dl | ||||
| Mean ± SD | 1.72 ± 1.41 | 1.15 ± 1.2 | U 3.1 |
0.001 S |
| Range | 0.50-7 | 0.50-4.2 | ||
| Median | 2 | 1.6 | ||
| Serum Albumin gm/dl | ||||
| Mean ± SD | 2.78 ± 0.70 | 3.01 ± 0.70 | T 1.99 |
0.048 S |
| Range | 2.0-4.0 | 1.90-4.60 | ||
| Median | 3 | 2.95 | ||
| Group B | Test of sig. | P-value | ||||
| Group A | No=63 | |||||
| No=87 | ||||||
| No | % | No | % | |||
| Longitudinal splenic diameter (LSD) (cm) | ||||||
| Mean ± SD | 16.21 ± 3.83 | 14.50 ± 4.03 | 0.01 | |||
| Range | Sep-33 | Sep-32 | t | |||
| Median | 16 | 13 | 2.61 | |||
| Portal vein diameter(mm) | ||||||
| Mean ± SD | 12.45 ± 2.77 | 10.20 ± 2.06 | ||||
| ˂0.001 | ||||||
| Range | 19-Sep | 17-Jun | t | HS | ||
| Median | 12 | 10 | 5.96 | |||

| ALBI Score |
Group A No=87 |
Group B No=63 |
Mann-Whitney Test | P-Value |
| Mean ± SD | -1.45 ± 0.69 | -1.81 ± .64 | U 3.25 |
0.001 S |
| Range | -2.91-0.75 | -2.85-0.72 | ||
| Median | -1.5 | -1.89 |
| - | - | - | - | - | ||
| Group A | Group B | |||||
| No = 87 | No = 63 | Test of Sig. | P-Value | |||
| No | % | No | % | |||
| ALBI grade | ||||||
| G1 | 5 | 5.74 | 5 | 7.92 | ||
| G2 | 41 | 47.13 | 41 | 65.1 | ||
| G3 | 41 | 47.13 | 17 | 26.98 | 6.25 | 0.043 |
| ALBI-platelet score | ||||||
| 2 | 1 | 1.15 | 2 | 3.17 | ||
| 3 | 29 | 33.34 | 27 | 42.86 | ||
| 4 | 50 | 57.47 | 28 | 44.45 | FXT | 0.057 |
| 5 | 7 | 8.04 | 6 | 9.52 | 7.5 | |
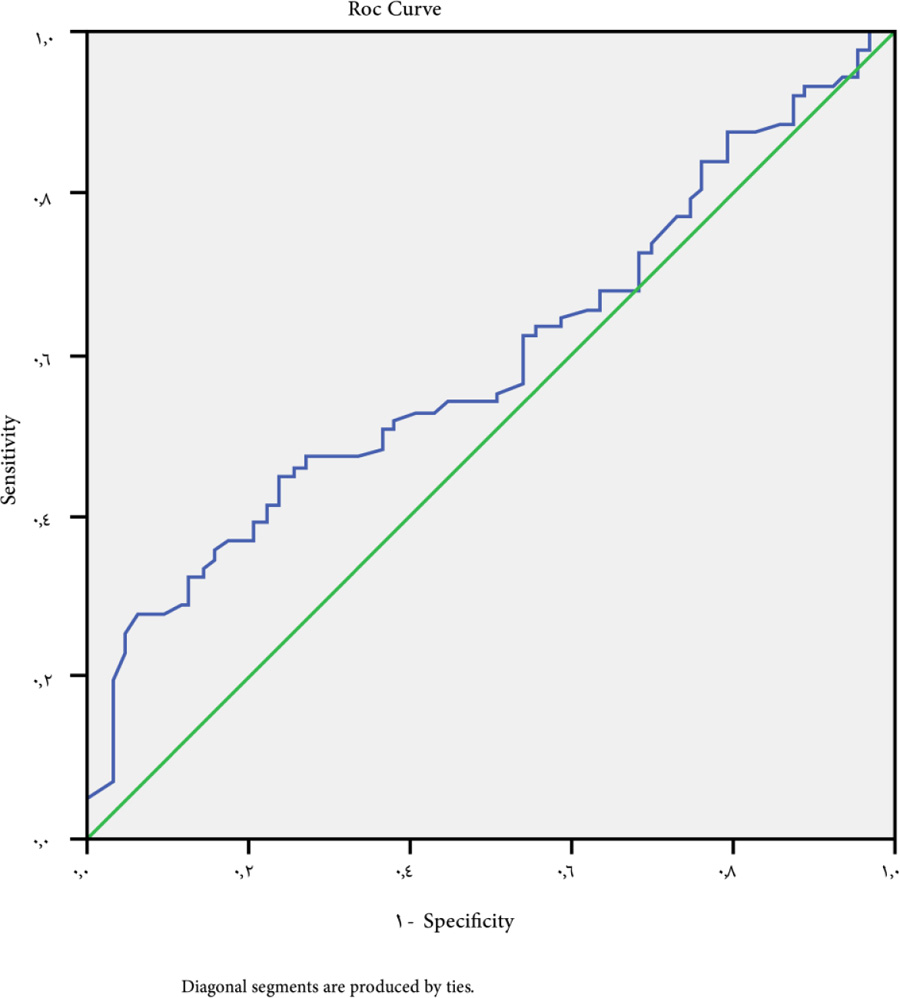
A cutoff value for ALBI score is -1.67 as the point for prediction of patients with esophageal varices (P value =0.046), 52.9% sensitivity, 59.6% specificity, 47% negative predictive value (NPV) and 64% positive predictive value (PPV) (Fig. 2).
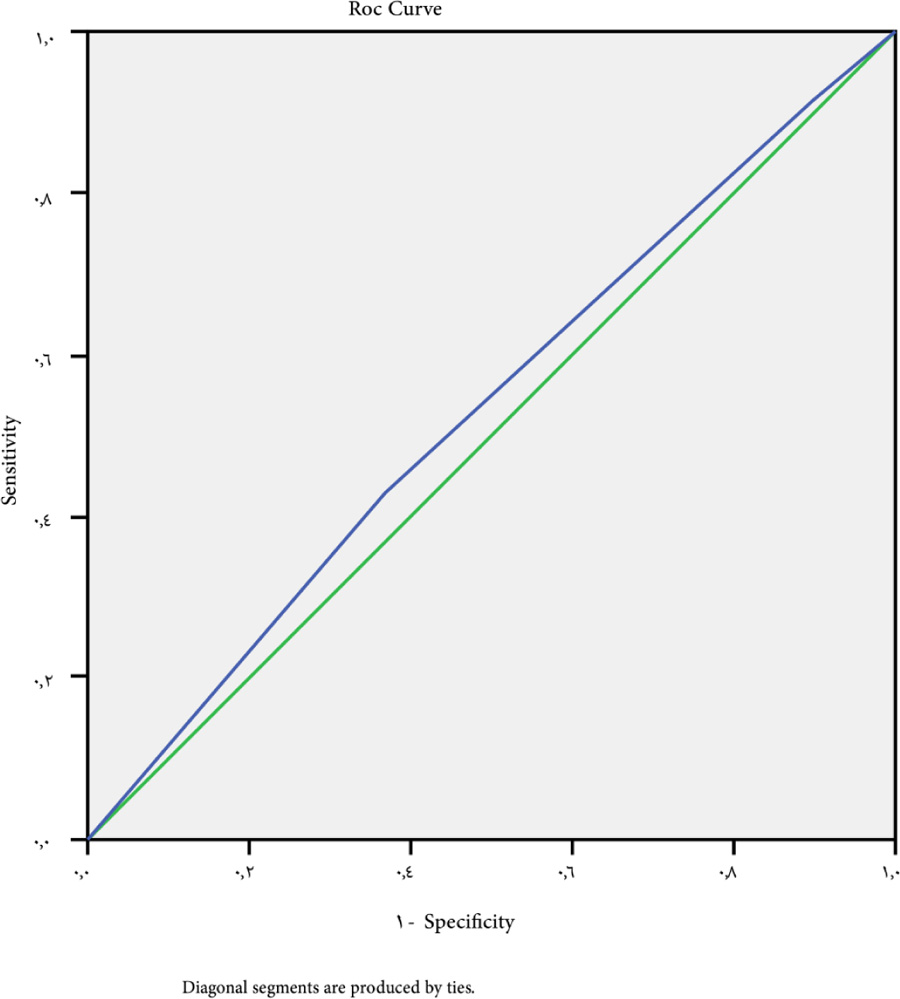
At a cutoff value for ALBI-platelet score >3 for the prediction of patients with esophageal varices whatever the size, P-value is 0.040, sensitivity 42.5%, specificity 63.5%, NPV 40% and PPV 65% (Fig. 3).
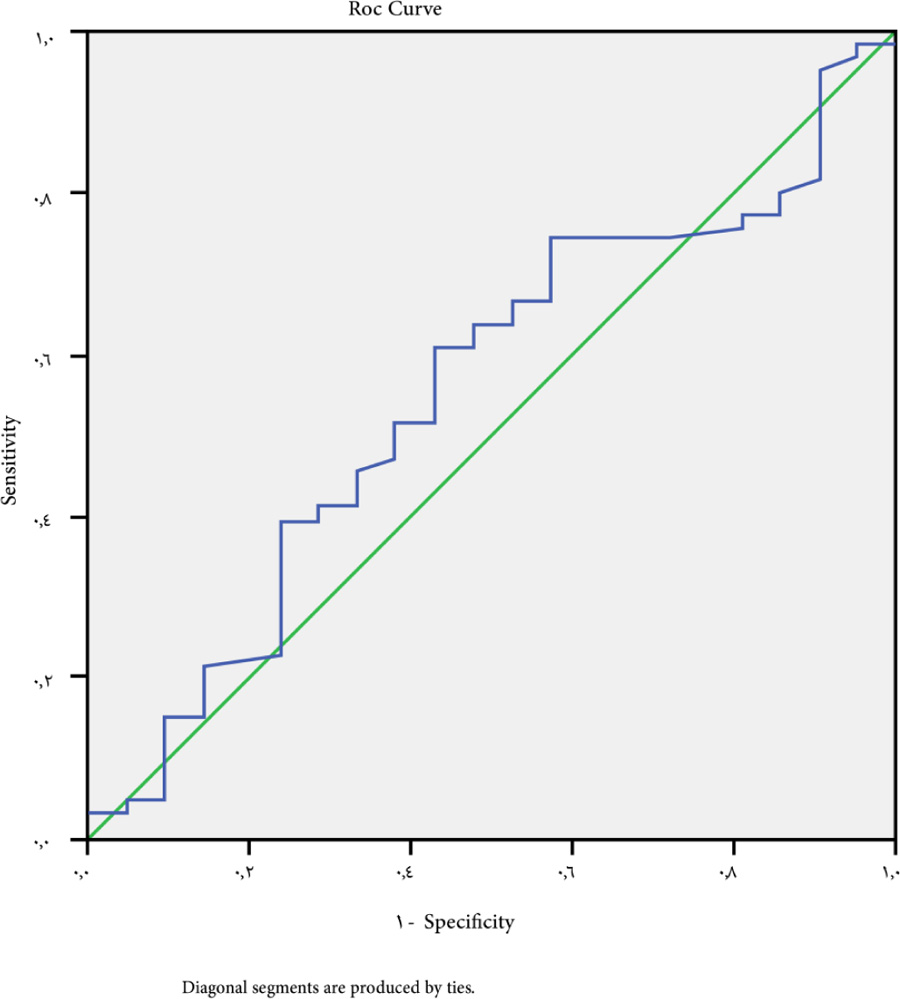
A cutoff point of -1.27 for large esophageal varices (grades III and grade IV) had a P-value of 0.056. The ROC curve indicated a sensitivity of 69.7%, a specificity of 42.9%, NPV is 52% and PPV is 40% (Fig. 4).
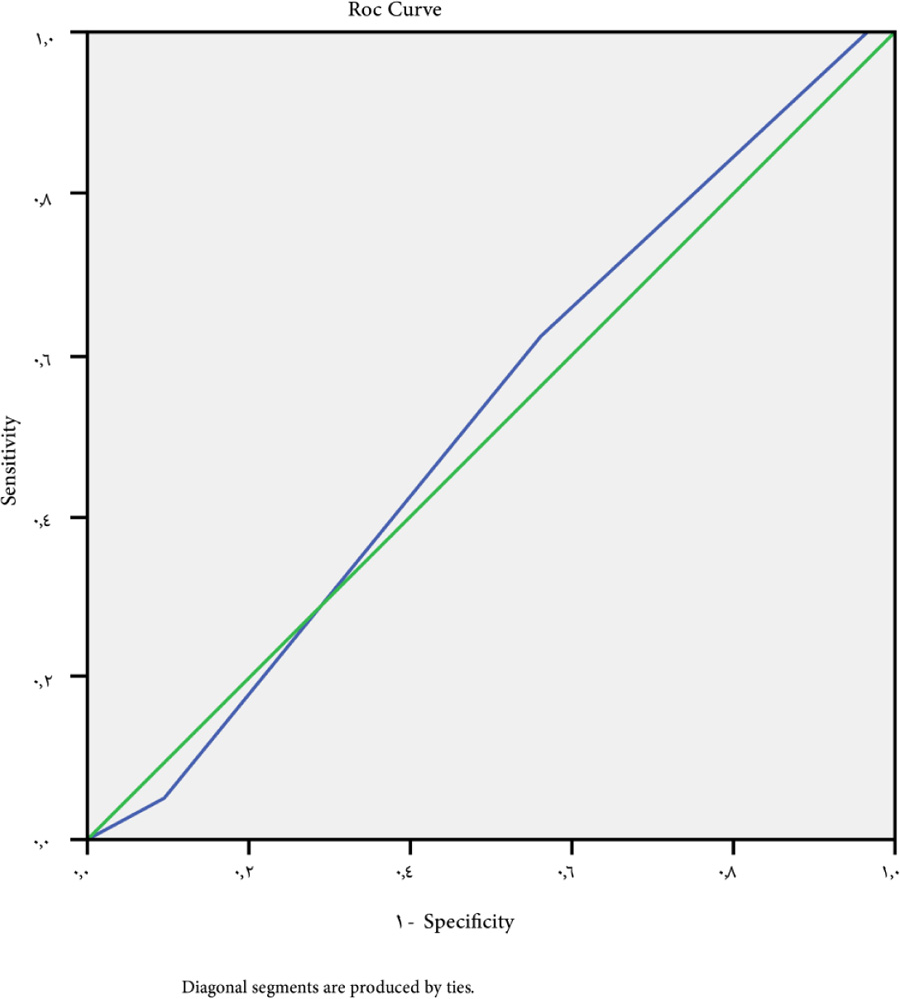
The cutoff point of ALBI-platelet score for large-sized varices>4 has 61.9% sensitivity, 55% specificity, 59% NPV, 50% PPV, and 0.070 P-value (Fig. 5).
4. DISCUSSION
The search for low-cost, simple-to-use non-invasive techniques for early detection of esophageal varices, utilizing biological parameters, radiological techniques, or a combination of both, is a top priority to minimize the need for endoscopy as a screening procedure [19].
Cherian et al. [20] found that the existence of esophageal varices was significantly associated with the Child-Pugh score among 229 cirrhotic patients, and that the higher classes; Child B/C, were important predictors of large esophageal varices presence.
The Global Guidelines of the World Gastroenterology Organization, According to a study published in 2013, the existence of gastroesophageal varices is associated with the incidence of liver disease, with varices present in 40% of Child A, 85% of Child C, and 16% of hepatitis C patients with bridging fibrosis [21].
No substantial difference was found between the studied groups in terms of MELD score in our study; this is close to Zou et al. [22].
In patients with liver cirrhosis, Gunda et al. [23] found that a low platelet count is strongly linked to the existence of the large esophageal varices.
Among our patients with esophageal varices, total bilirubin was significantly higher and albumin was significantly lower (p=0.001 and 0.048, respectively). This may be explained by the fact that patients with EV have higher Child class, and an elevated bilirubin level is a sign of deteriorating hepatic function. This is in line with what Ali et al. [24] had documented.
Soga, et al. [25] found that serum albumin was substantially lower in patients with gastroesophageal varices and a higher rate of mortality. Controlling serum albumin is crucial in preventing gastroesophageal variceal bleeding, according to the researchers.
Khan and Iman [26] discovered a strong negative association between serum albumin level and EV severity (r = -0.587; p = 0.000; p 0.01), implying that serum albumin level could be used to predict the severity of esophageal varices. On the other hand, Demyrel et al. [27] found no connection between the severity of esophageal varices and serum albumin or Serum Ascites Albumin Gradient (SAAG) levels. They discovered only a weak relation between ascitic albumin levels and esophageal varices grades.
In this study, patients with EV had a substantially larger splenic longitudinal diameter (SLD) (>16cm) (p=0.010). This is due to the fact that splenomegaly is a strong predictor of the elevated portal pressures that cause the development of varices.
Hassan et al. [28] also registered a statistically significant increase in SLD in patients with EV as compared to patients without it. They found that an SLD of 13.1 cm or less had 100% sensitivity and 65% specificity for predicting EV. According to Jamil et al. [29], a cutoff point of >11 cm splenic diameter detected esophageal varices with a sensitivity of 83.75% and a specificity of 64.29%.
In this study, patients with EV had a significantly higher portal vein diameter (>12mm) than those without (p-value=0.001). Jamil et al. also previously identified an increase in PVD in patients with varices [29]. However, they discovered that the cutoff point for PVD (>12 mm) only had a sensitivity of 51.25%and a specificity of 65.71%, making it an unsatisfactory non-invasive marker for predicting esophageal varices.
The albumin-bilirubin score (ALBI) was found to be substantially different between the studied groups and could be used as a predictor for esophageal varices in our research. At a cutoff point -1.67, P-value was 0.046, 52.9% sensitivity, 59.6% specificity, 64% PPV, and 47% NPV.
The ALBI score was also found to be an indicator for variceal prediction by Zou et al. [22]. The study's cutoff point was -1.492, had 100% sensitivity, 69.62% specificity, 7.4% PPV, and 100% NPV. Alsebaey et al. [30] found that an ALBI cutoff point of -2.43 was an accurate predictor of EV with 81.28% sensitivity, 74.89% specificity, 58.9% PPV, and 90% NPV.
The ALBI score had a sensitivity of 69.7%, a specificity of 42.9%, positive predictive value of 40%, and negative predictive value of 52% when used to detect large-sized varices at a cutoff point of -1.27. This has been verified in the two studies: Chen et al. [18] in a study on patients with hepatocellular carcinoma (HCC), found that sensitivity of the ALBI score to predict high risk esophageal varices in compensated HCC patients was 96,0%, 27.1% specificity, 21.1% PPV, and 97.1% NPV.
Alsebaey et al. [30] found that ALBI > -1.88 had 92.96% sensitivity, 60.61% precision, 55.9% PPV, and 94.1% NPV for large varices discrimination.
We found that the platelet count can be used as an indicator of esophageal varices, at a cutoff point of 154.5, with 30.2% sensitivity, 79.8% specificity, 68% PPV, and 45% NPV. The study by Ravi et al. [31] reported that a platelet count of less than 68.000/mm3 (P-value=0.02) could be used as an indicator for esophageal varices in patients with hepatic cirrhosis, with a sensitivity of 71% and a specificity of 73%. Galizzi et al. [32] reported that compensated cirrhotic patients with platelets >150,000 and transient elastography of liver <20 KPa, are less likely to have EV and can avoid unnecessary endoscopy.
Abdelsallam et al. [33] also found that the incidence of thrombocytopenia increased the higher the grade of the esophageal varices. According to Tafarel et al. [34], a platelet count of less than 93.000/mm3 (P-value0.01) has a sensitivity of 65.7% and a specificity of 57.9% and can be used as an indicator for esophageal varices.
Low platelet counts were independently correlated with the existence of large esophageal varices, according to Thomoboulos et al. [35]. Just a few patients (12.8%) with platelets of 118(×109/l), a spleen length of 13.5 cm, and no ascites had small varices when other parameters were taken into account. Those with a platelet count of 118(×109/l), a spleen length of >13.5 cm, and ascites, on the other hand, were 83.3% more likely to have a high risk varices. On the contrary, the platelet count, according to Qamar et al. [36] is not an indicator of the presence or production of gastroesophageal varices (GEVs) in liver cirrhosis.
According to Hutson et al. [37], 11 of 13 thrombocytopenic patients improved their peripheral platelet count after portocaval shunt surgery. There was an increase in platelet count in patients who underwent TIPS placement, according to Jalan et al. [38], but no association was found between portal pressure or spleen size and platelet count recovery. ALBI-PLT score can predict the presence of esophageal varices in compensated cirrhotic patients and hence can be used as a simple and non-invasive tool to detect patients at low risk for development of EV to avoid unnecessary screening endoscopy, according to Saleh et al. [39]. Miyamoto et al. found that the ALBI-PLT score had a significant association with the endoscopic findings of GEVs and the incidence of GEVs increased as the ALBI-PLT score increased .Also, the incidence of high-risk varices increased as the score increased [40].
In our study, the ALBI-PLT score was found to be capable of predicting the existence of esophageal varices at a cutoff point of >3, with a sensitivity of 42.5%, a specificity of 63.5%, NPV of 40%, and PPV of 65%, with a P-value of 0.04. With a sensitivity of 61.9%, a specificity of 55%, NPV of 59%, PPV of 50%, and a P-value of 0.07, a cutoff point of >4 may be used as a predictor for large varices.
The study by Alsebaey et al. is in agreement with ours and found that an ALBI-PLT score of 3 had a sensitivity of 77.34%, a specificity of 72.93%, a PPV of 55.86%, and an NPV of 87.90%. Also, for the ALBI-PLT score> 4, the same cutoff value had 39.44% sensitivity, 75% specificity, 45.9% PPV, and 69.7% NPV [30].
Comparing to another non-invasive marker, Verma et al. [10] showed that there was a significant correlation between the APRI and HVPG in patients with cirrhosis (r = 0.365). Hsieh et al. [41] observed a strong correlation between HVPG and the ALBI score, whereas all the other noninvasive markers had a weak correlation with HVPG.
CONCLUSION
Our findings revealed the ALBI-PLT score to be a low-cost, readily available, and accurate new non-invasive indicator of the existence of esophageal varices, which could be used to test for the presence of esophageal varices and risky large-sized EV in cases of HCV-related hepatic cirrhosis, reducing the need for endoscopic screening.
AUTHORS' CONTRIBUTION
Authorship statement: All the authors participated sufficiently in the work and approved the final version of the manuscript.
ETHICS APPROVAL AND CONSENT TO PARTICIPATE
The research was approved by the Ethical Committee of Faculty of Medicine Research, Tanta University, Egypt with approval number 32678/11/18.
HUMAN AND ANIMALS RIGHTS
No animals were used for studies that are the basis of this research. All the humans used were in accordance with the ethical standards of the committee responsible for human experimentation (institutional and national), and with the Helsinki Declaration of 1975, as revised in 2013 (http://ethics.iit.edu/ecodes/node/3931).
CONSENT FOR PUBLICATION
Informed written consent was taken from each patient.
STANDARDS OF REPORTING
STROBE guidelines and methodologies were followed in this study.
AVAILABILITY OF DATA AND MATERIALS
Not applicable.
FUNDING
None.
CONFLICT OF INTEREST
The authors declare no conflict of interest, financial or otherwise.
ACKNOWLEDGEMENTS
The authors acknowledge all patients participating in this study and take responsibility for all aspects of the reliability and freedom from bias of the data presented and their discussed interpretation.