All published articles of this journal are available on ScienceDirect.

Stratum Corneum Biomarkers in Atopic Dermatitis: Biological and Spatial Variability
Abstract
Background:
Atopic dermatitis is a highly heterogeneous skin disease, mainly affecting children. Introduction of biological therapies has urged the development of biomarkers to facilitate personalized therapy. Stratum corneum biomarkers emerged as a promising non-invasive alternative to skin biopsy, yet validation of spatial and biological variability is essential for their application in clinical research.
Objective:
To assess spatial and biological variability of stratum corneum biomarkers for atopic dermatitis.
Methods:
Stratum corneum was collected from 17 atopic dermatitis patients by consecutive application of eight adhesive tapes to a lesional skin site and 2 cm and 4 cm from the lesion. Two non-lesional sites at a 2 cm distance from the same lesion were collected to determine biological variability. Filaggrin degradation products (NMF) were determined by liquid chromatography and thirteen cytokines (IL-4, IL-13, IL-18, IL-31, IL-33, CCL17, CCL22, CCL27, CXCL8, IL-1α, IL-RA, IL-18, IL-22) by multiplex immunoassay.
Results:
Biomarker levels showed gradual changes from lesional to non-lesional skin sites at 2 cm and 4 cm; magnitude and direction of change were biomarker-specific. Intra-subject variability ranged from 17.3% (NMF) to 85.1% (CXCL8). Biomarker levels from two stratum corneum depths were highly correlated; several biomarkers showed significant depth dependence.
Conclusion:
Stratum corneum enables non-invasive collection of relevant immune and epidermal biomarkers, but biomarker-specific spatial and biological variability emphasizes the importance of standardized procedures for stratum corneum collection.
1. INTRODUCTION
Atopic Dermatitis (AD) is a common inflammatory skin disease affecting up to 20% of children and 7-10% of adults [1, 2]. The disease is characterized by the impaired skin barrier and aberrant immune response, and clinically manifests through recurrent dermatitis, dry and inflamed skin, severe itch and tendency toward bacterial and viral infections. AD has a strong genetic component; the highest known risk is associated with loss-of-function mutation in the Filaggrin Gene (FLG) [3]. Functional consequences of FLG mutations are not completely understood. Various studies showed reduced skin hydration in the FLG mutation carriers, which can be explained by the fact that filaggrin degradation products are the main ingredients of Natural Moisturizing Factors (NMF) [4]. FLG mutations are also associated with alterations in the structure and composition of the principal barrier of the skin, the Stratum Corneum (SC). SC is comprised of flattened cells (corneocytes) filled with keratin filaments that are aggregated by filaggrin, surrounded by a cornified envelope and embedded in the lipid matrix. The SC contains a large number of biomolecules crucial for the skin barrier and for antimicrobial and immune response, including various proteases, antimicrobial proteins and cytokines of different signature. An abundance of a wide range of biomolecules in the SC and its accessibility makes SC a promising biological medium to collect relevant biomarkers [5-9]. SC can easily and non-invasively be collected using adhesive tapes, a technique that has evidenced its potential for the study of various inflammatory skin diseases such as AD, psoriasis and contact dermatitis.
Most studies utilizing this technique are focused on AD. One of the reasons is the large heterogeneity of AD, reflected in different pathophysiologies and clinical phenotypes; this hampers diagnostics, disease severity assessment and therapy [9, 10]. Introduction of novel monoclonal therapies is a major breakthrough in therapy for AD, yet clinical trials have demonstrated that not all patients benefit from it and some patients experience adverse effects [11, 12]. Identification of molecular signature facilitating definition of endotypes would therefore be of great importance. Development of biologics initiated a cascade of studies on the potential biomarkers for the stratification of AD [10, 13], but most of them are focused on blood samples and there are only a few studies with skin biomarkers, mainly from skin biopsy [14-16]. As infants are the most affected population, a biopsy is not feasible, so alternative, non-invasive biomarkers are needed. In recent exploratory studies, we and other researchers have shown the potential of SC biomarkers [5, 6, 17]. There is, however, a need to further evaluate and validate this technique before it can be routinely applied in research and clinics. This is why in the present study, we investigate several factors that might be of relevance: i) difference between lesional and non-lesional skin, ii) the effect of the distance from the lesion, iii) the influence of the SC depth from which a tape is taken, iv) intra-subject variability assessed by collection of SC from two similar skin sites (2 cm from the same lesion), and v) analytical variability.
2. METHODS AND MATERIALS
2.1. Subjects
Seventeen AD patients, three males and fourteen females, with a mean age of 29 years (range 19-40), all Caucasians, were recruited between May and July 2019 at the outpatient clinic of the Dermatology Department of University Hospital Centre in Zagreb. The patients met the Hanifin and Rajka (1980) criteria for the diagnosis of AD [18]. Severity of disease was assessed using the Scoring Atopic Dermatitis (SCORAD) tool [19]. All patients had moderate or severe AD (mean SCORAD was 46.0, range 28.8-76.1). The skin samples were taken from the forearm (15 patients), neck (1 patient) and leg (1 patient), depending on the location of the lesion.
Written informed consent was obtained from all subjects prior to the study. The experimental protocol was approved by the Medical Ethical Committees of University Hospital Centre Zagreb and the University of Zagreb School of Medicine. The study was conducted in conformity with the Declaration of Helsinki principles.
2.2. Sampling of the Stratum Corneum
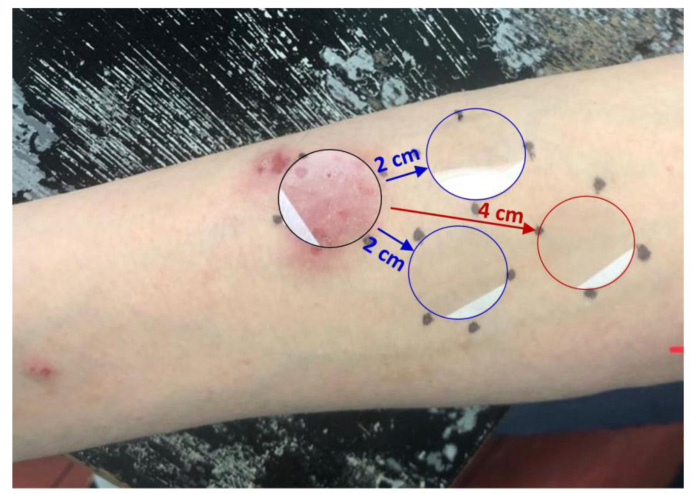
The SC was sampled using the previously described method [20]. Circular adhesive tapes (22 mm diameter, 3.8 cm2, D-Squame Discs; Monaderm, Monaco) were placed onto the volar forearm skin spot applying a pressure of 225 g/cm2 for 10 sec, using a D-Squame Pressure Instrument D500 (CuDerm Corporation, Dallas, TX, USA). The tape strips were gently removed with tweezers and placed individually in cryovials. Sequentially, eight consecutive tape strips were collected from each of the four different sites on the lower volar forearm; from eczematous skin area, from two skin areas that were 2 cm away from eczematous skin to determine intrapersonal variability, and from skin area that was 4 cm away from eczematous skin and immediately stored at -80°C (Fig. 1).
2.3. Determination of Filaggrin Degradation Products in the SC
NMF was defined as the sum of the concentrations of histidine, 2-pyrrolidone-5-carboxylic acid (PCA), and trans and cis isomers of Urocanic Acid (UCA). The 4th and 7th consecutive tape strips from each skin area were used to measure NMF levels at two different SC depths. NMF was determined according to the slightly adapted method described in detail elsewhere [20]. Briefly, NMF components on the 4th and 7th consecutive tape strips were extracted with 600 µL of Millipore water and subsequently analyzed by High-Performance Liquid Chromatography (HPLC).
As the amount of the SC on the tape strips varies, the NMF concentration in the SC on each tape was normalized by the total protein content. Due to incomplete extraction recovery of SC proteins by water, the second extraction of proteins from the tape stripping was performed with 0.1 mol/L KOH solution. Proteins in both extracts were determined using the Pierce Micro BCA Protein Assay Kit (Thermo Fischer Scientific, Rockford, IL, USA), with bovine serum albumin supplied as standard. NMF levels in the SC were expressed as mmol NMF/g protein.
2.4. Cytokine Analysis in Tape Strips
The 5th and 8th consecutive tape strips from each skin area were used to measure cytokine levels at two different SC depths. The cytokines were extracted from the tape by adding 1.2 mL phosphate-buffered saline (Merck, Darmstadt, Germany) containing 0.005% Tween 20 (Sigma-Aldrich, Zwijndrecht, The Netherlands) to each vial. Extraction of cytokines and soluble proteins was performed with an ultrasound sonication bath (Branson 5800, Branson Ultrasonics BV, The Netherlands) for 15 minutes in ice water. Extract aliquots of 200 µL were distributed in vials and stored at -80°C until further analysis.
In total, concentrations of thirteen cytokines were determined using MESO QuickPlex SQ 120 (MSD, Rockville, MA, USA) according to the manufacturer’s instructions. Eleven cytokines were measured on preconfigured multiplex panels (U-plex assays, MSD, Rockville, MA, USA). The following cytokines were included: IL-1α, IL-1RA, IL-4, IL-13, IL-18, IL-22, IL-31, IL-33, CCXL8 (IL-8), CCL17 (TARC), CCL20 (MIP-3α), CCL22 (MDC) and CCL27 (CTACK). The extracts were applied undiluted, with the exception of IL-1α and IL-1RA, which were first diluted 10 times with extraction buffer.
As the amount of SC on the tape varies, the amount of cytokine in the SC on each tape was normalized by the protein content, which was determined using the Pierce Micro BCA Protein Assay Kit (Thermo Fischer Scientific, Rockford, IL, USA) with the bovine serum albumin supplied as standard.
For statistical analysis, cytokine concentrations below the detection limit (but above the bottom of the curve) or above the detection limit were taken unchanged, and cytokine concentrations that were below the fit curve range (signal below the bottom of the bottom-of-the-curve fit, no concentration given) were assigned half the value of the lowest sample concentration below the detection limit to maintain the ranking order. The limit of detection for each cytokine was calculated by Discovery Workbench 4.0 software (MSD, Rockville, MA, USA) as 2.5 standard deviations above the background signal. Due to the high number of samples (more than 30%) with concentration values below the detection limit, IL-4, IL-13, IL-31 and IL-33 were excluded from further statistical analysis.
2.5. Statistical Analysis
As the distribution of cytokine concentrations was skewed, they were log-transformed prior to statistical analysis. Calculations were performed by using Prism 8 software (GraphPad, San Diego, CA, USA).
Repeated-measures ANOVA followed by post-test for linear trend was used to determine differences in NMF and cytokine levels between eczematous skin and skin areas that were 2 cm and 4 cm away from the eczematous skin. The differences in NMF and cytokine levels between two skin areas that were 2 cm away from eczematous skin or between two SC depths on the same skin area were determined by two-sided paired t-test or Wilcoxon matched-pairs signed rank test. P-value < 0.05 was considered significant. Distribution of data was tested by Shapiro-Wilks normality test.
To determine the level of intra-subject and analytical variability, the original, non-transformed values of cytokines and NMF concentrations were used. Intra-subject variability was calculated from cytokine and NMF concentrations measured on two parallel skin areas that were 2 cm away from the eczematous skin, and analytical variability was calculated from duplicate measurements of the same sample on all four skin spots and expressed as coefficient of variations relative to the mean (CVS and CVA, respectively). This enabled estimation of CV due to biological variability: CVB = {(CVS)2 – (CVA)2}1/2.
3. RESULTS
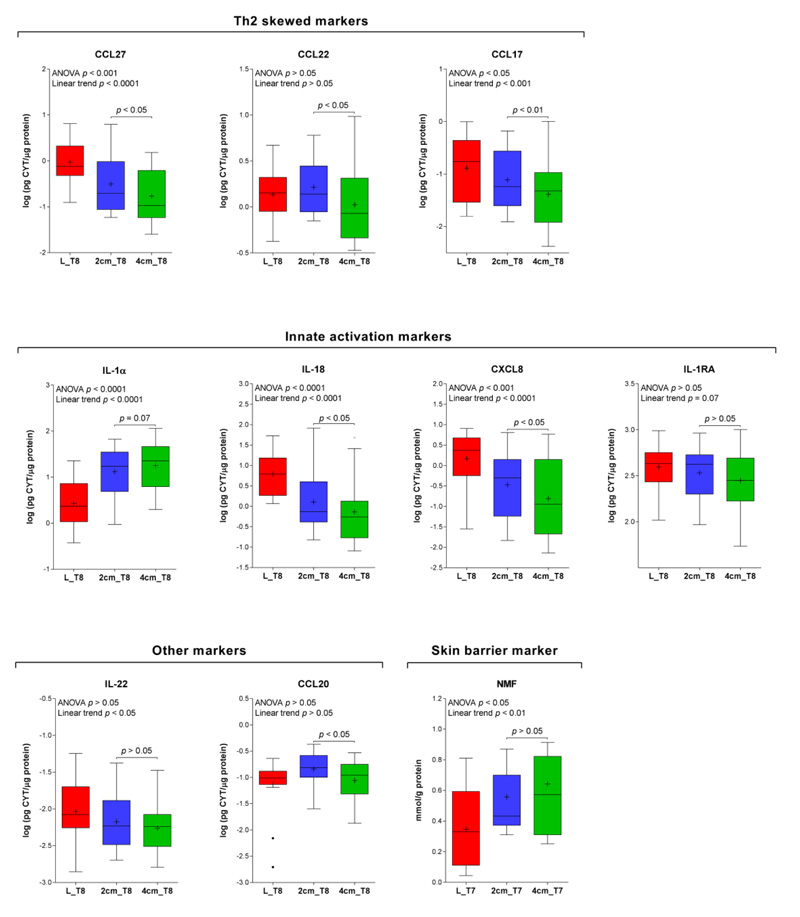
The median levels of the biomarkers from the lesional (L) and two non-lesional sites at respectively 2 cm and 4 cm are shown in Fig. (2). Presented data were obtained from tape strip no. 8. Among Th-2 mediated cytokines, CCL27 and CCL17 showed a linear trend from lesional to non-lesional skin sites, respectively 2 cm and 4 cm from the lesion. They also displayed significant differences between skin sites at 2 cm and 4 cm. The same pattern was obtained for innate activation markers IL-1α, IL-18 and CXCL8 and a skin barrier biomarker, NMF. No significant difference between two non-lesional skin sites was found for IL-22 and CCL20. With the exception of IL-1α and NMF, the biomarker concentrations evidenced a decreasing trend from the lesional to the non-lesional skin sites.
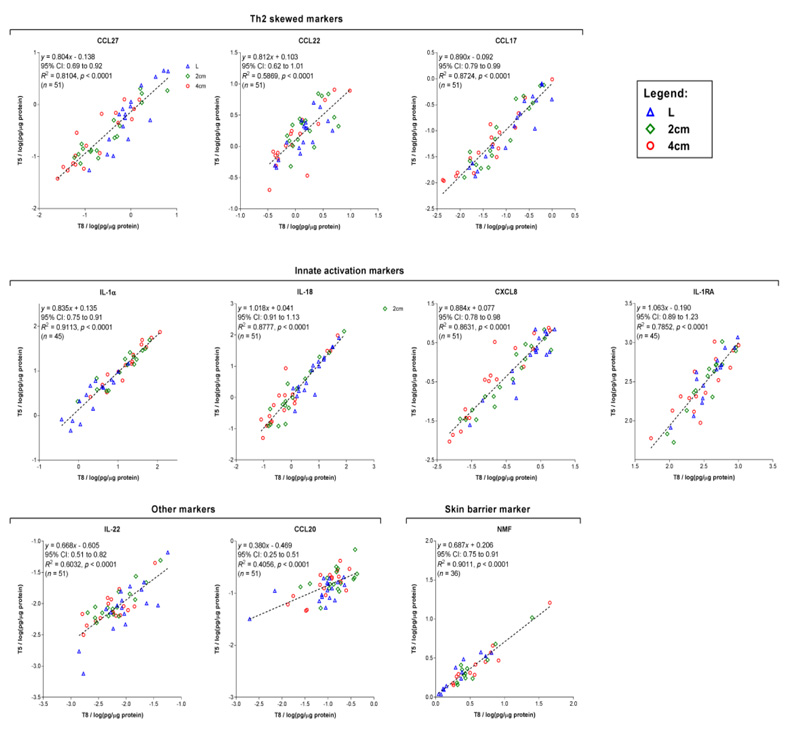
A similar pattern in the concentration profiles from lesional to non-lesional skin sites was likewise found for the 5th tape strip (data not shown). This is consistent with a good correlation between the biomarker levels determined on tapes 5 and 8 for most biomarkers. A somewhat lower but still highly significant association was found for CCL20, CCL22 and IL-22 (r2 of 0.41, 0.59 and 0.60, respectively) (Fig. 3). As seen from the regression analysis (Figure. 3), the slope of the regression line for some biomarkers clearly deviates from 1, implying a systematic difference in the concentrations measured at two depths. Two IL-1 cytokines (IL-1α and IL-18) and NMF showed significantly higher levels on tape 8 than on tape 5 (relative differences of 22, 19 and 9%, respectively), while CCL22, CCL20 and IL-22 showed an opposite trend (relative differences of 27, 27 and 18%, respectively).
Intra-subject variability derived from the two non-lesional skin sites 2 cm from the same lesion (Fig. 1) is listed in Table 1. Intra-subject variability expressed as coefficient of variation (CV) largely fluctuated between biomarkers and ranged from 17.3% for NMF to 85.1% for CXCL8. Analytical variability, obtained from duplicate measurements of the same sample, was lower for all biomarkers than intra-subject variability, and ranged from 1.7% for IL-1RA to 31.7% for CCL20.
| - | *Intra-subject Variability | Analytical Variability | *Biological Variability |
|---|---|---|---|
| CVS (%) | CVA (%) | CVB (%) | |
| CCL27 | 36.4 | 2.5 | 36.4 |
| CCL22 | 38.9 | 11.6 | 37.1 |
| CCL17 | 81.9 | 8 | 81.6 |
| IL-1α | 36 | 20.3 | 29.7 |
| IL-18 | 43.9 | 6 | 43.5 |
| CXCL8 | 85.1 | 3.9 | 85 |
| IL-1RA | 40 | 1.7 | 40 |
| IL-22 | 58.2 | 9.3 | 57.5 |
| CCL20 | 45.3 | 31.7 | 32.4 |
| NMF | 17.3 | ** | ** |
**Analytical variability of individual components of NMF previously published [20].
4. DISCUSSION
To our knowledge, this is the first study to evaluate the SC tape stripping method for the effect of spatial variability (distance from the lesion, SC depth) as well as intra-subject variability. As children are the population most affected by AD, simplicity and non-invasiveness of the tape stripping method provide a powerful tool for diagnostics, disease severity assessment and therapy monitoring of this common inflammatory disease.
4.1. Differences Between Lesional and Non-lesional Skin and Distance from Lesion Effect
Most of the immune markers, in particular pro-inflammatory cytokines show significant changes between lesional and non-lesional skin. This fits with other studies that have measured these cytokines at the mRNA level in the SC [6, 7, 13, 14]. Interestingly, in most studies that sampled non-lesional skin either by tape or by biopsy, the location of the non-lesional skin site relative to the distance from the sampled lesion site is not specified. The results from the present study do show a clear effect of the distance from the lesion, whereas the magnitude of the effect was biomarker-specific. Th-2 biomarkers CCL27 and CCL17, as well as CXCL8 and IL-18, show a gradual decrease in concentration from the lesional to the non-lesional skin sites at 2 cm and 4 cm, respectively. For example, CCL27 and CXCL8 had respectively 1.8-fold and 3-fold lower concentrations at the 4 cm skin site than at the 2 cm skin site. As several studies reported that non-lesional skin sites are more closely associated with disease severity than lesional skin, the findings from the present study are relevant and stress the need for standardization of the sampling location for the non-lesional skin site [15, 16].
Interestingly, in contrast to other cytokines, IL-1α showed lower concentrations in lesional than in non-lesional skin. Several studies showed that the SC levels of IL-1α are lower in atopic skin than in healthy skin, likely due to the skin barrier damage and exhaustion of the pre-formed pool of this pro-inflammatory cytokine [17, 21]. NMF levels displayed an increasing trend from lesional skin to respectively 2 cm and 4 cm non-lesional skin sites. This fits with the opposite pattern of Th-2 cytokines CCL17 and CCL27 measured on these skin sites and supports previous studies showing downregulation of filaggrin due to Th-2 cytokine milieu [22, 23]. In previous studies, we demonstrated that NMF is a suitable biomarker of skin barrier damage in various skin inflammatory diseases [8, 17, 24]. NMF are important for skin hydration, skin pH and mechanical properties of SC, and therefore a relevant biomarker in AD, a disease characterized by an altered skin barrier [4].
The pattern of spatial differences regarding distance from the lesion was consistent for both SC depths (i.e. tapes 5 and 8) for all biomarkers.
4.2. Stratum Corneum Depth
The cytokine levels collected from different depths highly correlated in both lesional and non-lesional skin sites. This is advantageous, as for the analysis mostly one tape is sampled – usually the 5th or 6th consecutive tape. It should be noted that SC depth does not exactly correspond with the tape number, i.e. AD patients have looser SC than healthy subjects, so a specific tape number in AD would correspond with the deeper SC layer [25]. It must be stressed that, despite the high correlation, the concentrations of some cytokines at two SC depths significantly differed. Interestingly, innate activation markers including IL-1α and IL-18 showed higher concentrations at a deeper SC layer (tape no. 8), while CCL22, CCL20 and IL-22 showed the opposite trend. To partly compensate for the concentration-depth difference, it might be useful to collect tapes from different depths and pool their extracts before analytical determination.
NMF values also presented a clear depth-concentration difference, as found in previous studies conducted by Raman confocal microscopy or HPLC [26]. Nevertheless, similarly to the cytokines, NMF concentrations from different SC depths were highly correlated, as previously shown [27].
4.3. Intra-subject Variability
As with the spatial effect, intra-subject variability showed to be biomarker-specific (Table 1). Among cytokines, the smallest variability was found for IL-1α (36%), while chemokines had larger variability ranging from 36.4% for CCL27 to 85% for CXCL8 (85.1%).
There are several possible reasons underlying observed biomarker-specific differences in intra-subject variability. First, IL-1α, the cytokine with the smallest inter-individual variability, is present in the SC in more than 100-fold higher concentrations than other cytokines, and analytical variability contributes to overall variability to a lesser extent. Additionally, IL-1α is produced constitutively by keratinocytes, while excretion of other cytokines – including pro-inflammatory CXCL8, Th-2 mediated cytokines, and chemokines – is triggered by immune response, and these cytokines are produced not only by keratinocytes but also by other cells. Importantly, intra-subject variability was determined from two skin spots that were equidistant to the lesion but did not entirely represent identical skin sites. In some patients, one of the 2 cm sites was closer to another lesion, which likely influenced cytokine levels. Although intra-subject differences for some cytokines seem rather high, it should be considered that cytokine levels in AD skin are several times higher than in healthy skin. For example, we recently found two- to 35-fold higher levels of CCL17, CCLX8 and IL-18 in AD patients compared to healthy subjects [5, 8], so inter-individual differences largely outweigh intra-individual variability. To compensate, at least partly, for large variability of some biomarkers, multiple sampling is recommended.
4.4. Limitations of the Study
There are several limitations to this study. First, the majority of subjects were women (80%), and furthermore all of them were Caucasian adults. This limits the generalizability of our findings to the general AD population, and emphasizes the need for evaluation of biomarker variability in the investigated population.
CONCLUSION
This study evaluates for the first time relevant sampling conditions that might affect the validity of SC biomarkers in AD: distance from the lesion and SC depth. The findings are relevant as they reveal a biomarker-specific effect regarding sampling location. Biomarker-specific intra-subject variability should also be taken into account by study design and statistical power calculations. Evaluation of the sampling procedure and magnitude of intra-subject variability represent an important step in the validation of SC biomarkers. Tape stripping is a minimally invasive procedure, with the added advantage that it provides insight into the skin barrier function and immune response. This is why SC biomarkers have a large potential in clinical trials and clinical practice.
LIST OF ABBREVIATIONS
| AD | = Atopic Dermatitis |
| CV | = Coefficient of Variation |
| Cis-UCA | = Cis-Urocanic Acid |
| FLG | = Filaggrin Gene |
| His | = Histidine |
| NMF | = Natural Moisturizing Factors |
| PCA | = Pyroglutamic Acid |
| SC | = Stratum Corneum |
| SCORAD | = SCORing Atopic Dermatitis |
| Trans-UCA | = Trans-Urocanic Acid |
AUTHORS’ CONTRIBUTION
S. Kezic, I. Jakasa and R. Jurakic Toncic had full access to all of the data in the study and take responsibility for the integrity of the data and the accuracy of the data analysis. Study concept and design: all authors. Acquisition and interpretation of data: all authors. Drafting of the manuscript: S. Kezic, I. Jakasa and S. Ljubojevic Hadzavdic. Critical revision of the manuscript for important intellectual content: all authors. Administrative, technical and material support: all authors. Study supervision: all authors.
ETHICS APPROVAL AND CONSENT TO PARTICIPATE
The experimental protocol was approved by the Medical Ethical Committees of University Hospital Centre Zagreb (02/21 AG) and the University of Zagreb School of Medicine, Croatia (380-59-10106-19-111/51).
HUMAN AND ANIMAL RIGHTS
No animals were used in this research. All human research procedures followed were in conformity with the ethical standards of the committee responsible for human experimentation (institutional and national), and with the Helsinki Declaration of 1975, as revised in 2013.
CONSENT FOR PUBLICATION
Written informed consent was obtained from all subjects prior to the study.
AVAILABILITY OF DATA AND MATERIALS
The datasets used and/or analyzed during the current study are available from the corresponding author IJ upon reasonable request.
FUNDING
Financial support for this study was provided by Croatian Science Foundation, Croatia (grant number IP-2018-01-5978).
CONFLICT OF INTEREST
The author declares no conflict of interest, financial or otherwise.
ACKNOWLEDGEMENTS
We acknowledge support from the CA COST Action CA16113 CliniMARK.